


Equity Analysis and News
| Price | 200DMA | RSI | IG Sentiment | |
|---|---|---|---|---|
| Europe | ||||
| FTSE 100 | 7094 | 7462 | 61 | Mixed |
| DAX | 11518 | 12426 | 48 | Mixed |
| CAC 40 | 5102 | 5354 | 49 | Mixed |
| FTSE MIB | 19390 | 21936 | 48 | - |
| US | ||||
| S&P 500 | 2711 | 2762 | 46 | Bullish |
| DJIA | 25164 | 25093 | 50 | Mixed |
| Nasdaq 100 | 6941 | 7130 | 43 | - |
| Asia | ||||
| Nikkei 225 | 21912 | 22431 | 44 | - |
| Shanghai Composite | 2676 | 3023 | 59 | - |
| ASX 200 | 5849 | 6067 | 51 | - |
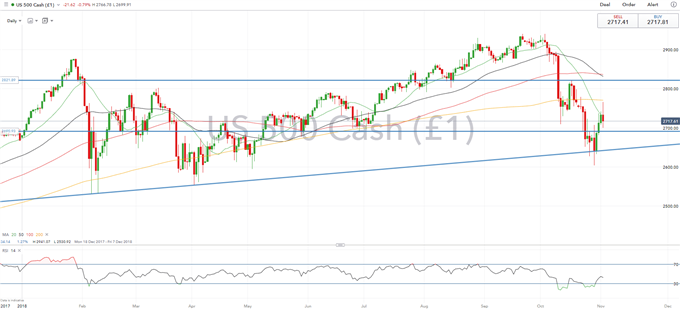
S&P 500 | Dead Cat Bounce?
The S&P 500 had made a modest recovery following support at the rising trendline stemming from the 2018 low. However, topside resistance in the form of the 200DMA held firm and in turn sees the index paring back the highs of the week. Investors will be placing a keen eye on the Mid-Term elections which could see a jump in volatility for equity markets. Based on recent polling data and historical performances in Mid-Term elections, the Republican party are at risk of losing the Lower House to the Democratic, which may place pressure on US indices. Support in the S&P 500 is seen at 2690-2700, a break below raises scope for another test of the rising trendline. (Mid-Term Election Preview)
S&P 500 Price Chart: Daily Time Frame (Dec 2017 – Nov 2018)
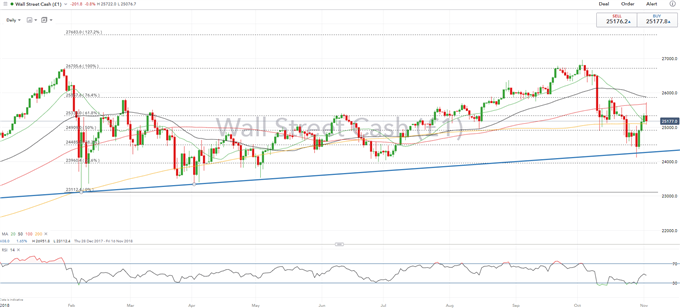
DJIA | Trendline Support Back into Play
Much like the S&P 500, the trendline support is back into play for the Dow Jones following the rejection off the 100DMA, while the price had also been notably exhausted above the 50% Fibonacci Retracement. Robust growth in the US, alongside, wages rising at its fastest pace since 2009 may stoke a more optimistic Fed on its current assessment on the US economy and thus adding pressure on US equity markets. Despite the recovery in equity markets, sentiment remains fragile and risks remain tilted to the downside.
DJIA Price Chart: Daily Time Frame (Dec 2017 – Oct 2018)
RESOURCES FOR FOREX & CFD TRADERS
Whether you are a new or experienced trader, we have several resources available to help you; indicator for tracking trader sentiment, quarterly trading forecasts, analytical and educational webinars held daily, trading guides to help you improve trading performance, and one specifically for those who are new to forex.
--- Written by Justin McQueen, Market Analyst
To contact Justin, email him at Justin.mcqueen@ig.com
Follow Justin on Twitter @JMcQueenFX


