


Weekly Fundamental US Stocks Forecast: Neutral
- Seasonality studies for the past 5-, 10-, and 20-years show November is one of the best months of the year for US stocks, with the second half of the month producing the majority of gains during the month.
- US equity markets can continue to trade higher in the short-term as long as US Treasury yields – and Fed hike odds – don’t resume their climbs.
- The IG Client Sentiment Index suggests thatUS stocks have a bullish bias in the near-term.

US Stocks Week in Review
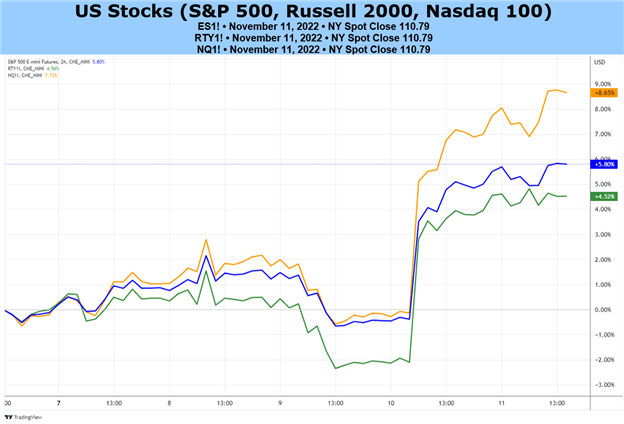
It was an exceptionally strong week for US equity markets, as decelerating price pressures, per the October US inflation report, eased concerns about the Federal Reserve continuing along its aggressive rate hike path. The US S&P 500 rallied by +5.8%, the tech-heavy US Nasdaq 100 gained an impressive +8.65%, and the small-cap focused US Russell 2000 added +4.52%. The combined pullback in short-end US Treasury yields and volatility measures proved critical to the rebound across global and US equity markets.
Seasonality Favors Gains in US Equity Markets
The first two weeks of November have produced rapid gains for US equity markets, in line with historical tendencies. Seasonality studies going back 5-, 10, and 20-years show November is a very strong month for stocks. The seasonal tendency, particularly heading into the second half of the month, may help provide a strong tailwind during a period where the fundamental backdrop has not shifted meaningfully.
US S&P 500Seasonality: DAILY TIMEFRAME (20-year average) (CHART 1)

Source: EquityClock.com
US Nasdaq 100Seasonality: DAILY TIMEFRAME (20-year average) (CHART 2)

Source: EquityClock.com
US Russell 2000Seasonality: DAILY TIMEFRAME (20-year average) (CHART 3)

Source: EquityClock.com
With US real GDP tracking at +4% annualized in 4Q’22 per the Atlanta Fed GDPNow growth tracker, coupled with resilient earnings (69% of S&P 500 companies have reported a positive EPS surprise and 71% have reported a positive revenue surprise, per FactSet), there is reason to believe that US equity markets can continue to trade higher in the short-term. The fact of the matter is that many fund managers have underperformed in 2022, so there may be a tendency to ‘chase’ markets higher into year-end.
Economic Calendar Week Ahead
The turn through the middle of November promises a relatively lighter US economic calendar, considering the past two weeks have already seen the November Fed meeting, the October US jobs report, and the October US inflation report. There are only two ‘high’ rated releases in the coming days, but the calendar sees a steady flow of information Monday through Thursday nevertheless.
- On Monday, November 14, Tyson Foods will report earnings pre-market. Fed Governor Brainard will give remarks at 16:30 GMT.
- On Tuesday, November 15, Walmart and Home Depot will report earnings pre-market. The October US producer price index (PPI) is due at 13:30 GMT. Boston Fed President Cook will give a speech at 14 GMT. Fed Vice Chair Barr will give testimony at 15 GMT.
- On Wednesday, November 16, Lowe’s, TJX Companies, and Target will report earnings pre-market. Weekly US mortgage applications data will be published at 12 GMT. The October US retail sales report will be released at 13:30 GMT. October US industrial production figures are due at 14:15 GMT. New York Fed President Williams will give a speech at 14:50 GMT. September US business inventories data and the November US NAHB housing market index will be released at 15 GMT. Fed Vice Chair Barr will continue his testimony at 15 GMT. Fed Governor Waller will give remarks at 19:35 GMT. September US net long-term TIC flows figures will be published at 21 GMT. NVIDIA and Cisco Systems will report earnings after hours.
- On Thursday, November 17, Alibaba Group will report earnings pre-market. October US building permits and housing starts are due at 13:30 GMT, as are weekly US jobless claims figures and the November US Philadelphia Fed manufacturing index. Fed Governor Bowman will give a speech at 14:15 GMT, followed by Fed Governor Jefferson at 15:40 GMT.
- On Friday, November 18, JD.com will report earnings pre-market. The October US Conference Board leading index will be released at 15 GMT, as will the October US existing home sales report.

US S&P 500 PRICE VERSUS COT NET NON-COMMERCIAL POSITIONING: DAILY TIMEFRAME (November 2020 to November 2022) (CHART 4)
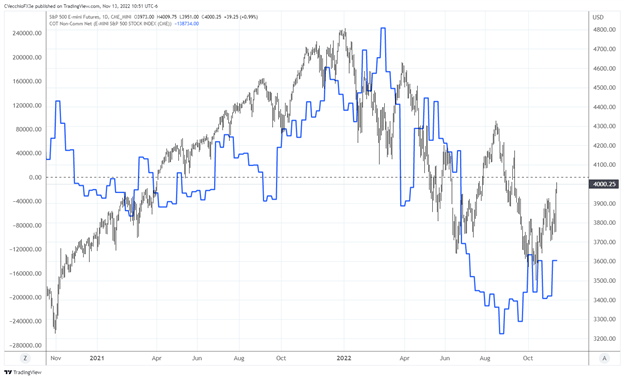
Next, a look at positioning in the futures market. According to the CFTC’s COT data, for the week ended November 8, speculators decreased their net-short US S&P 500 futures positions to 138,734 contracts, down from the 197,860 net-short contracts held in the week prior. Considering the sharp rally that took place after the prior reporting period closed, it is likely that there is a dramatic reduction in net-shorts in the forthcoming report.
IG CLIENT SENTIMENT INDEX: US S&P 500 PRICE FORECAST (November 11, 2022) (CHART 5)
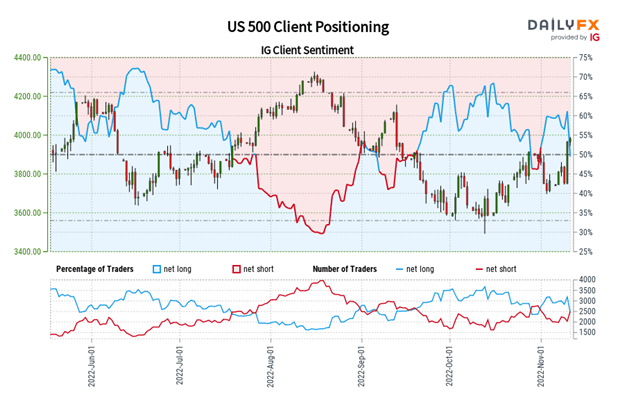
US 500: Retail trader data shows 50.55% of traders are net-long with the ratio of traders long to short at 1.02 to 1. The number of traders net-long is 1.30% lower than yesterday and 20.07% lower from last week, while the number of traders net-short is 0.82% lower than yesterday and 23.98% higher from last week.
We typically take a contrarian view to crowd sentiment, and the fact traders are net-long suggests US 500 prices may continue to fall.
Yet traders are less net-long than yesterday and compared with last week. Recent changes in sentiment warn that the current US 500 price trend may soon reverse higher despite the fact traders remain net-long.

--- Written by Christopher Vecchio, CFA, Senior Strategist


