


GOLD PRICE FUNDAMENTAL FORECAST – TALKING POINTS
- XAUUSD has tiptoed around the $1,300 price area for most of 2019 but its next move could be telling if gold’s long-term uptrend will prevail or if the precious metal will start breaking lower
- Fundamental factors like demand for the anti-risk asset and the Federal Reserve’s latest view on the economy could serve as possible catalysts that dictate gold’s next direction
- Download the free DailyFX Gold Forecast here for comprehensive insight from our analysts on the gold market
Spot gold rose to $1,302.13 as of Friday’s close, a mere 0.32 percent gain on the week as prices remain anchored around the current level. A weak US Dollar helped boost gold prices higher early in the week, but traders shied away from the precious metal after muted CPI data hurt demand for the asset which generates appeal for its inflation-hedging properties.
Although XAUUSD price action has recently been largely dominated by technical indicators, that could quickly change as fundamental forces impacting gold come into focus next week. With the Fed’s latest stance on monetary policy and the market’s subsequent reaction to its announcement likely taking the spotlight, commodity traders will closely watch gold for a breakout – or breakdown – that looms.
SPOT GOLD PRICE CHART: DAILY TIME FRAME (AUGUST 09, 2018 TO MARCH 15, 2019)
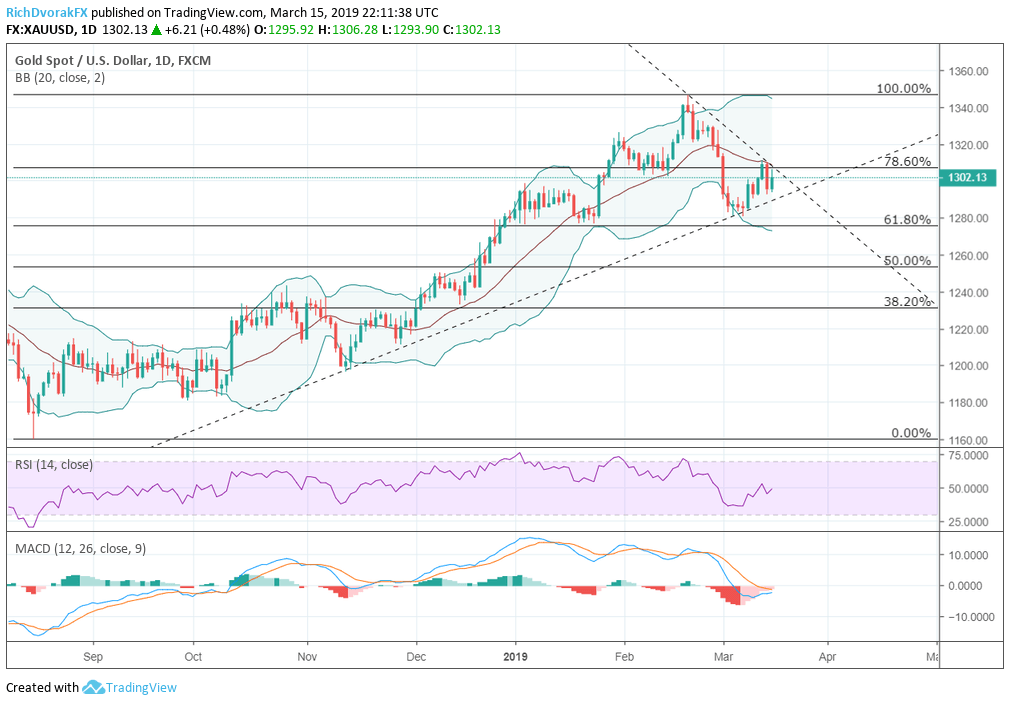
The chart above shows how the price of gold has coiled between its longer-term uptrend and shorter-term downtrend. At the same time, XAUUSD has fallen below its 0.786 Fibonacci retracement line drawn from the low last August to February’s high. This line rests slightly above the $1,300 price level where prices have previously based. However, after falling below this support level, it has now become resistance which is also touching the 20-day moving average.
Meanwhile, US equities have climbed over 12 percent since the beginning of the year while anti-risk assets such as gold and Treasuries remain bid. This recent trend seems particularly unusual given the current stage of the business cycle and typical relationship between stocks, gold and yields.
SPOT GOLD VS S&P500 VS US 10-YEAR TREASURY YIELD PRICE CHART: DAILY TIME FRAME (JANUARY 02, 2019 TO MARCH 15, 2019)
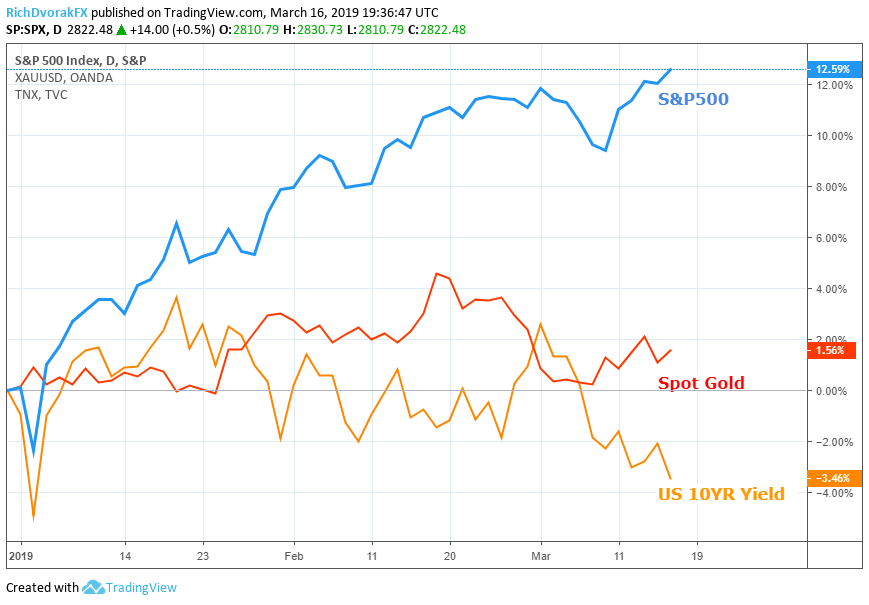
Yields have come under pressure following the Federal Reserve’s dovish shift away from tightening. In response, equities staged a roaring comeback after falling into bear market territory at the end of last year as investors celebrated the return of easy-money policy from the Fed. However, fears over slowing global growth still linger in the background and is illustrated by the persistent downward pressure on long term yields and resilience of gold.
Investor angst over how far out the next recession is could easily flare up at any moment as it did in October and December 2018. When pessimism paralyzes markets, investors race to sell risky assets like stocks and pile into safe havens like gold and bonds which drives yields down and gold prices up. With the FOMC set to meet next week for the second time this year, markets will receive an updated perspective on the Fed’s policy and its latest reading of the economy.
Further dovishness expressed by Chair Powell could send yields plummeting to their lowest level of the year, especially if growth forecasts are cut or the Fed’s dot plot projection is lowered. Although equities might get a boost from cheap money monetary policy, lower yields and slower growth is likely to push gold higher. On the contrary, no change to outlook or update on the Fed’s balance sheet tapering could disappoint gold bulls. Consequently, the upcoming FOMC meeting will likely be telling where gold prices head from here. So how are gold traders positioned headed into next week?
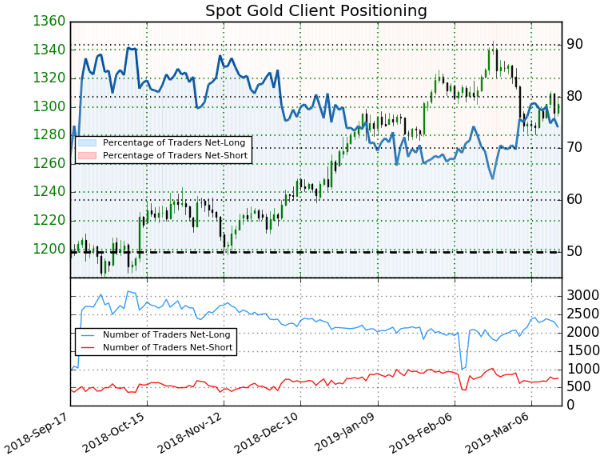
SPOT GOLD TRADER SENTIMENT
Check out IG’s Client Sentiment here for more detail on the bullish and bearish biases of EURUSD, GBPUSD, USDJPY, Gold, Bitcoin and S&P500.
According to IG client sentiment data, 74.1 percent of traders are net-long spot gold. This has resulted in a 2.85 long to short ratio while the number of spot gold traders net long has decreased by 9.1 percent relative to last week. Check out this free educational guide on how to analyze sentiment indicators and incorporate them into your trading strategy.
Visit our Education Center for more information on Free Trading Guides and Forecasts.
OTHER WEEKLY FUNDAMENTAL FORECASTS
Oil Forecast – Crude Oil Price Outlook Clouded by OPEC Meeting, Fed Rate Decision
USD Forecast – EUR/USD Rate Outlook Hinges on FORM Forward Guidance
GBP Forecast – Brexit Meaningful Vote: Third Time Lucky?
AUD Forecast – Australian Dollar Could Slide Again If RBA Speakers Stay Dovish
-Written by Rich Dvorak, Junior Analyst for DailyFX
-Follow @RichDvorakFX on Twitter
---


