


Talking Points
- The ides of March bring about a quad witching Friday, which may help explain the recent lift in equity markets.
- Gold prices may see a rebound as US Treasury yields break lower in the near-term.
- Retail traders are decidedly mixed on the US Dollar – EURUSD, GBPUSD, and USDJPY all have different biases.
Looking for longer-term forecasts on the US Dollar? Check out the DailyFX Trading Guides.
The US Dollar (via the DXY Index) is heading lower once again in what may be a weak finish to a disappointing week. US equity markets are pointing slightly higher on the morning, but US Treasury yields continue to soften, helping pave the way for a rebound in Gold and Silver prices. Meanwhile, it’s a quad witching Friday, a useful reminder that recent equity market moves may be driven by expiries of key options and futures contracts; once we’re through the ides of March, sentiment may rapidly change.
US-China Trade Talks at Impasse
As of yesterday we finished another cycle in the US-China trade war negotiations, with no deal coming to fruition. Sitting at the current impasse, we’re looking for signs that the cycle will start anew with fresh rhetoric that a deal could be reached in the coming weeks. The first such sign of a potential positive turn in sentiment may be coming from China, where the National People’s Congress just passed a law that will specific issues the international community has raised (like intellectual property sharing).
But given that the law is largely symbolic, it seems unlikely that US trade negotiators will see this as a measure considered concrete enough to finally schedule the long-awaited meeting between US President Donald Trump and Chinese President Xi Jingping.
Will UK PM May Get Her Deal Approved After All?
The latest Brexit updates coming across the news wire seem to indicate that UK Prime Minister Theresa May is not done trying to get her deal passed through UK parliament. The EU-UK Withdrawal Agreement remains, as she feels, the best option there is to deliver Brexit by the originally-intended March 29 deadline. Reports today indicate that PM May is whipping votes among the Northern Ireland DUP, whose support is absolutely necessary in order to see her agreement ratified by lawmakers. Whether or not DUP approval of PM May’s deal would be enough to convince other Euroskeptic Brexiteers to come around with their support is another question altogether.
US Treasury Yields Poised to Head Lower
Amidst the turbulent news flow around developments in the US-China trade negotiations and the Brexit talks, traders have been steadily pushing US Treasury yields lower. This comes as an affront to the move in equity markets, where the US S&P 500 is attempting to push to a fresh 2019 high. As it goes, the credit market tends to lead all other markets, including commodities and FX.
US Treasury 10-year Yield Chart: Daily Timeframe (March 2017 to March 2018) (Chart 1)
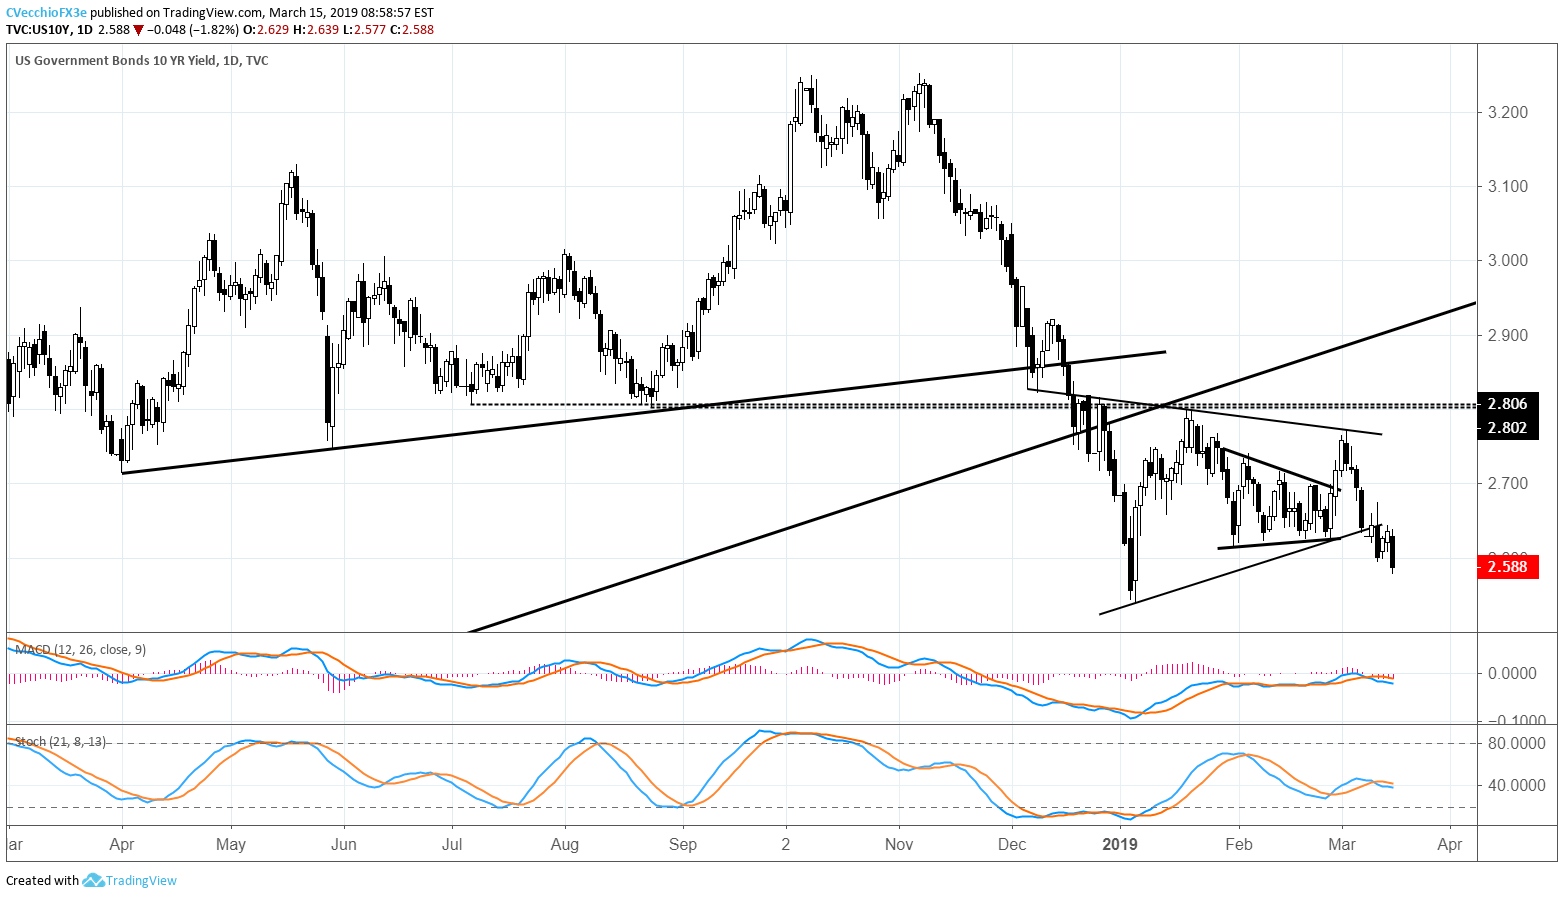
The recent breakdown in the US Treasury 10-year yield comes after roughly three months of consolidation in a symmetrical triangle. An attempt earlier in March to climb through triangle resistance failed, in turn vindicating the 2.802/2.806% area as key near-term resistance. The drop out of the symmetrical triangle may be deemed to be of increased importance given the context of the breakdown:
US Treasury 10-year Yield Chart: Daily Timeframe (March 2016 to March 2018) (Chart 2)
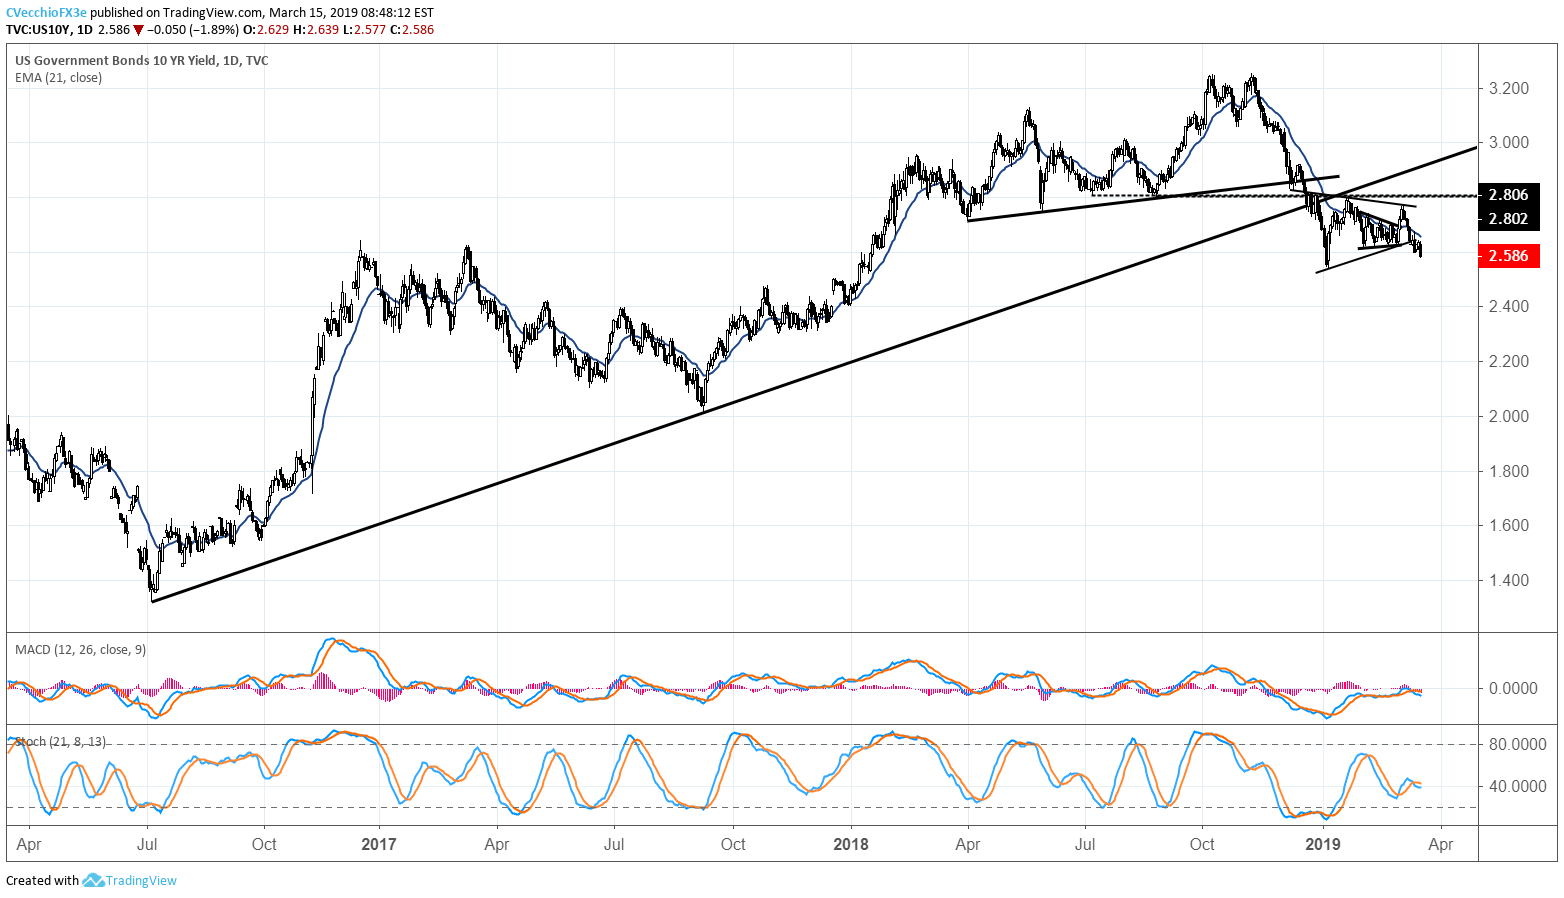
The symmetrical triangle formed following a break of the 2016 to 2018 uptrend. As is often the case, the higher probability move would be for lower yields. That is: a break of a long-term uptrend; followed by a symmetrical triangle consolidation; the triangle breaks lower. Regardless of the cause here – be it developments in the US-China trade war negotiations, Brexit, or speculation over the state of the US or even global economy – the effect of lower US Treasury yields will be felt in other asset classes.
US Treasury 10-year Yield: 20-day Correlation to Gold Prices (March 2017 to March 2018) (Chart 3)
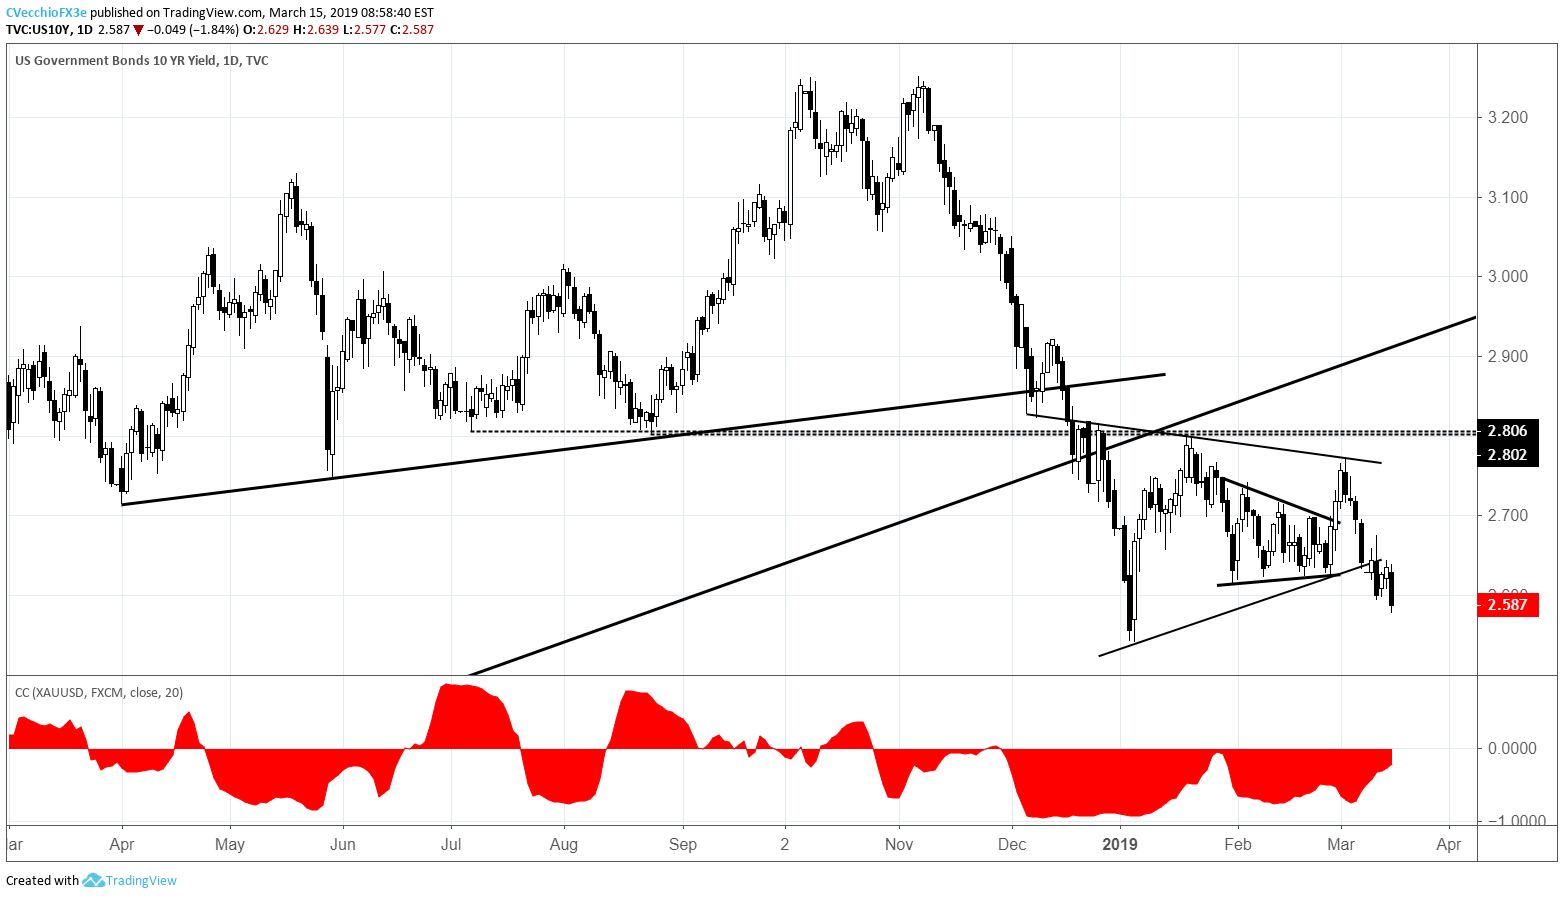
The turn lower in the US Treasury 10-year yield may prove beneficial to Gold prices, which have been struggling in recent weeks. Since the start of December, the US Treasury 10-year yield and Gold prices have held a negative 20-day correlation, ebbing and flowing in significance over the period. But the key fact is that US yields and Gold have proved to show the tendency to move in opposite directions.
Gold Price Chart: Daily Timeframe (March 2017 to March 2018) (Chart 4)

For now, this means that we may see Gold prices firm up in their turn higher. The recent pullback in prices saw the March low establish a “higher low” than the January swing lows. To this end, the series of higher lows is coming above the 61.8% retracement of the entire 2018 high-low range, a key area previously identified as the turning point for calling Gold’s price action that of a “bullish rally” rather than that of a “correction.” A weekly close back above the daily 21-EMA, coming in at 1303.53, would be a strong indication that more gains are due ahead.
DXY Index Price Chart: Daily Timeframe (June 2018 to March 2019) (Chart 5)
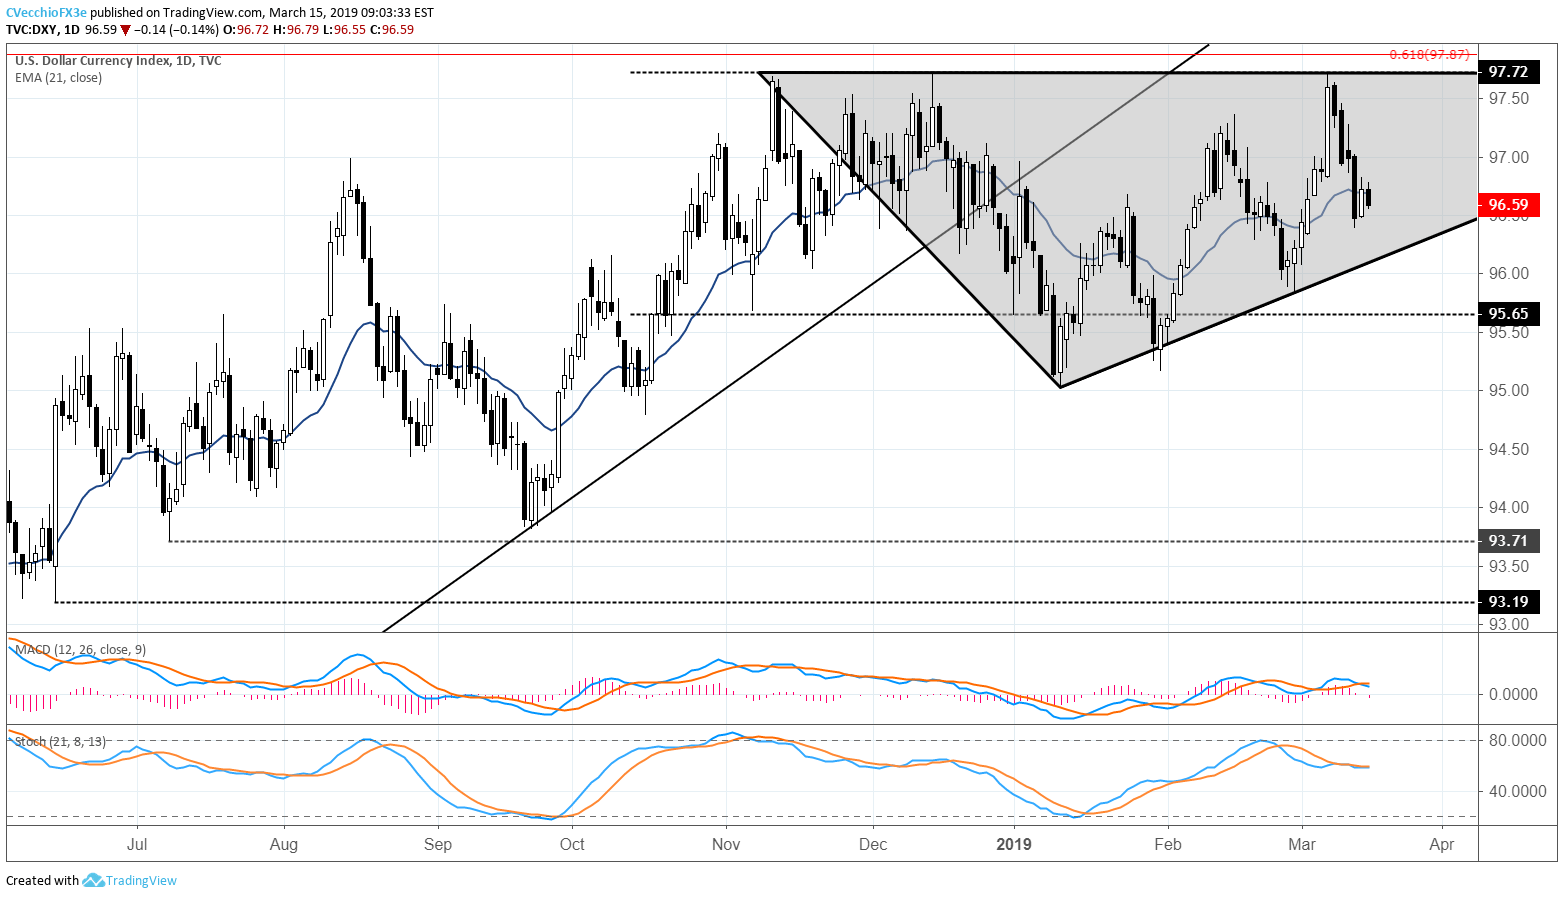
Not much has changed for the DXY Index this week as price oscillates within an ascending triangle in place since November. At present time, with US Treasury yields turning lower, there is some concern that the US Dollar is seeing its top appeal – higher yields than any other developed economy’s currency – weaken.
So, while the three-month consolidation may give a longer-term bullish bias in context of the consolidation developing after an uptrend, right now, the DXY Index’s forecast is necessarily neutral. Both daily MACD and Slow Stochastics have flattened out in bullish territory. Accordingly, with price still entangled in the daily 8-, 13-, and 21-EMA envelope, patience remains the modus operandi.
Read more: US Dollar Outlook Remains 'Neutral' - Awaiting Latest Brexit Vote
FX TRADING RESOURCES
Whether you are a new or experienced trader, DailyFX has multiple resources available to help you: an indicator for monitoring trader sentiment; quarterly trading forecasts; analytical and educational webinars held daily; trading guides to help you improve trading performance, and even one for those who are new to FX trading.
--- Written by Christopher Vecchio, CFA, Senior Currency Strategist
To contact Christopher Vecchio, e-mail at cvecchio@dailyfx.com
Follow him on Twitter at @CVecchioFX
View our long-term forecasts with the DailyFX Trading Guides


