


Gold Talking Points
Gold quickly approaches the 2019-high ($1326) as fresh data prints coming out of the U.S. economy dampen bets for a Federal Reserve rate-hike, and the Federal Open Market Committee (FOMC) Minutes may continue to shake up the near-term outlook for bullion as a bull-flag formation appears to be panning out.
Fundamental Forecast for Gold: Bullish
Gold breaks out of a narrow range as the 1.2% drop in U.S. Retail Sales along with the unexpected contraction in Industrial Production curbs the FOMC’s scope to implement higher interest rates, and it seems as though the central bank will continue to change its tune over the coming months amid the weakening outlook for growth and inflation.

After accounting for the dismal data prints, the Atlanta Fed’s ‘GDPNow model estimate for real GDP growth (seasonally adjusted annual rate) in the fourth quarter of 2018 is 1.5 percent on February 14, down from 2.7 percent on February 6,’ and signs of a more meaningful slowdown may continue to drag on interest-rate expectations as a growing number of Fed officials endorse a wait-and-see approach for monetary policy.
At the same time, the Fed appears to be on track to taper the $50B/month in quantitative tightening (QT) as Governor Lael Brainard indicates that the ‘balance-sheet normalization process probably should come to an end later this year,’ and it seems as though there’s a growing consensus at the central bank to conclude the normalization cycle ahead of schedule amid the ‘cross-currents’ surrounding the economic outlook.
Looking for a technical perspective on Gold? Check out the Weekly Gold Technical Forecast.
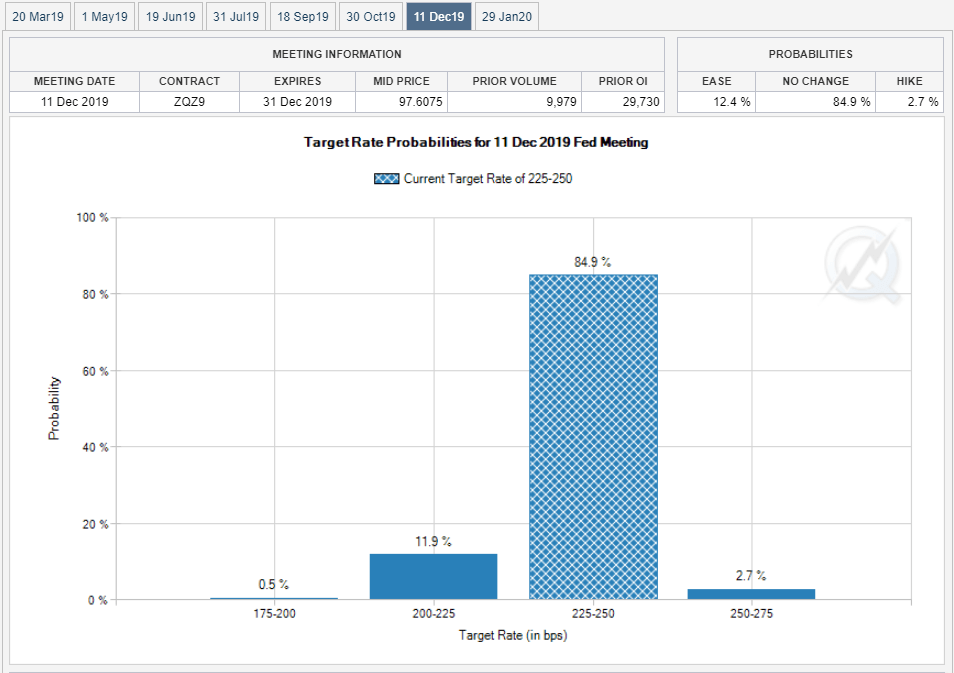
In turn, market participants may pay increased attention to the FOMC Minutes amid the material change in central bank rhetoric, and a further shift in the forward-guidance may heighten the appeal of gold especially as Fed Fund Futures shows the central bank on hold throughout 2019. With that said, gold may continue to exhibit a bullish behavior over the coming days, with the topside targets on the radar as the price and the Relative Strength Index (RSI)continue to track the upward trends from late-2018. Sign up and join DailyFX Currency Analyst David Song LIVE for an opportunity to discuss potential trade setups.
Gold Daily Chart
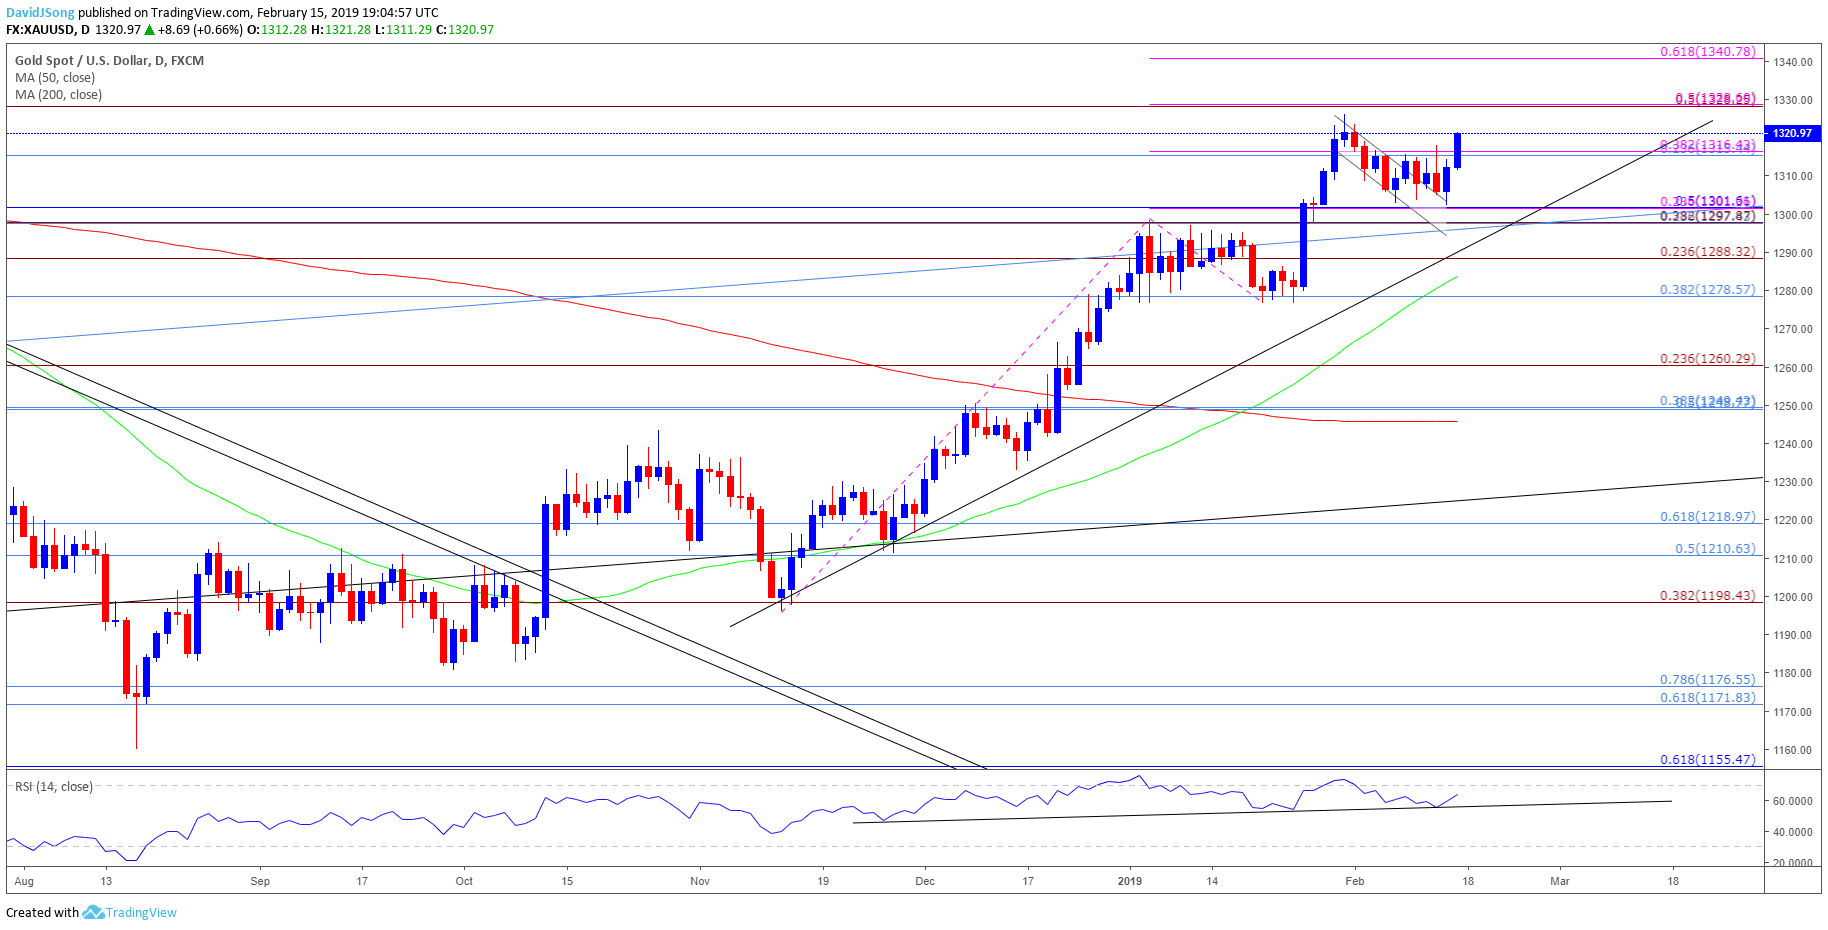
Gold appears to be on its way to test the 2019-high ($1326) as the former-resistance zone around $1298 (23.6% retracement) to $1302 (50% retracement) offers support, with the RSI highlighting a similar dynamic as it responds to trendline support. In turn, the $1328 (50% expansion) hurdle is back on the radar, with a break/close above the stated region opening up the $1340 (61.8% expansion) area.
Additional Trading Resources
Are you looking to improve your trading approach? Review the ‘Traits of a Successful Trader’ series on how to effectively use leverage along with other best practices that any trader can follow.
Want to know what other markets the DailyFX team is watching? Download and review the Top Trading Opportunities for 2019.
--- Written by David Song, Currency Analyst
Follow me on Twitter at @DavidJSong.
Other Weekly Fundamental Forecast:
Australian Dollar Forecast –May Head Lower If RBA Jawboning Starts Anew
Oil Forecast – Price Tied to Non-OPEC Supply Concerns, Lower Demand
British Pound Forecast – Sterling Struggles as the Brexit Clock Ticks
US Dollar Forecast –Needs Sentiment Consistency to Set Lasting Trend


