


US Dollar Talking Points:
- The US Dollar is at support as we begin a busy week with CPI set to be released tomorrow and the FOMC the day after.
- The US Dollar had a very strong first nine months of the year but that strength has pulled back over the past two-and-a-half months, leaving questions around trends into the end of the year and into 2023 trade.
- The analysis contained in article relies on price action and chart formations. To learn more about price action or chart patterns, check out our DailyFX Education section.

The US Dollar was on an aggressive trend in the first nine months of this year as the Fed continued with super-sized rate hikes. Since the Q4 open, however, that trend has come into question as prices have pulled back, helped along by surges in the Euro and British Pound as Central Banks in Europe and the UK hike rates in effort of stemming inflation. And with markets expecting the Fed to slow rate hikes into 2023, the faster pace of hikes out of Europe and the UK have allowed those currencies to claw back some of their prior losses against the USD.
This week’s economic calendar is loaded: We hear from Central Banks in the US, Europe and the UK over an 18-hour stretch on Wednesday afternoon and Thursday morning. We also get inflation reads out of each, with US CPI set to be released tomorrow, UK inflation to be released the day after (Wed morning) and the final read of European inflation for November set to be released on Friday.
After that, we’re heading into the end of the year as focus will likely begin shifting into 2023 trade. But, this week is huge for trends.
US Dollar
It took nine months to build, and two-and-a-half months to give back 50%. As a matter of fact, we’re right at that 50% mark of the 2022 move in the USD, which plots at 104.71. This level is very nearby another level of note, as the 23.6% retracement of the 2008-2022 major move plots at 104.38, and this helped to hold the low when it came into play last Monday.
November was the most bearish outing for DXY in over 10 years as rate hikes bets shifted, leading to a precipitous decline in the Greenback. The big question ahead of inflation and then the Fed is whether it’s bottomed yet.
US Dollar Weekly Chart
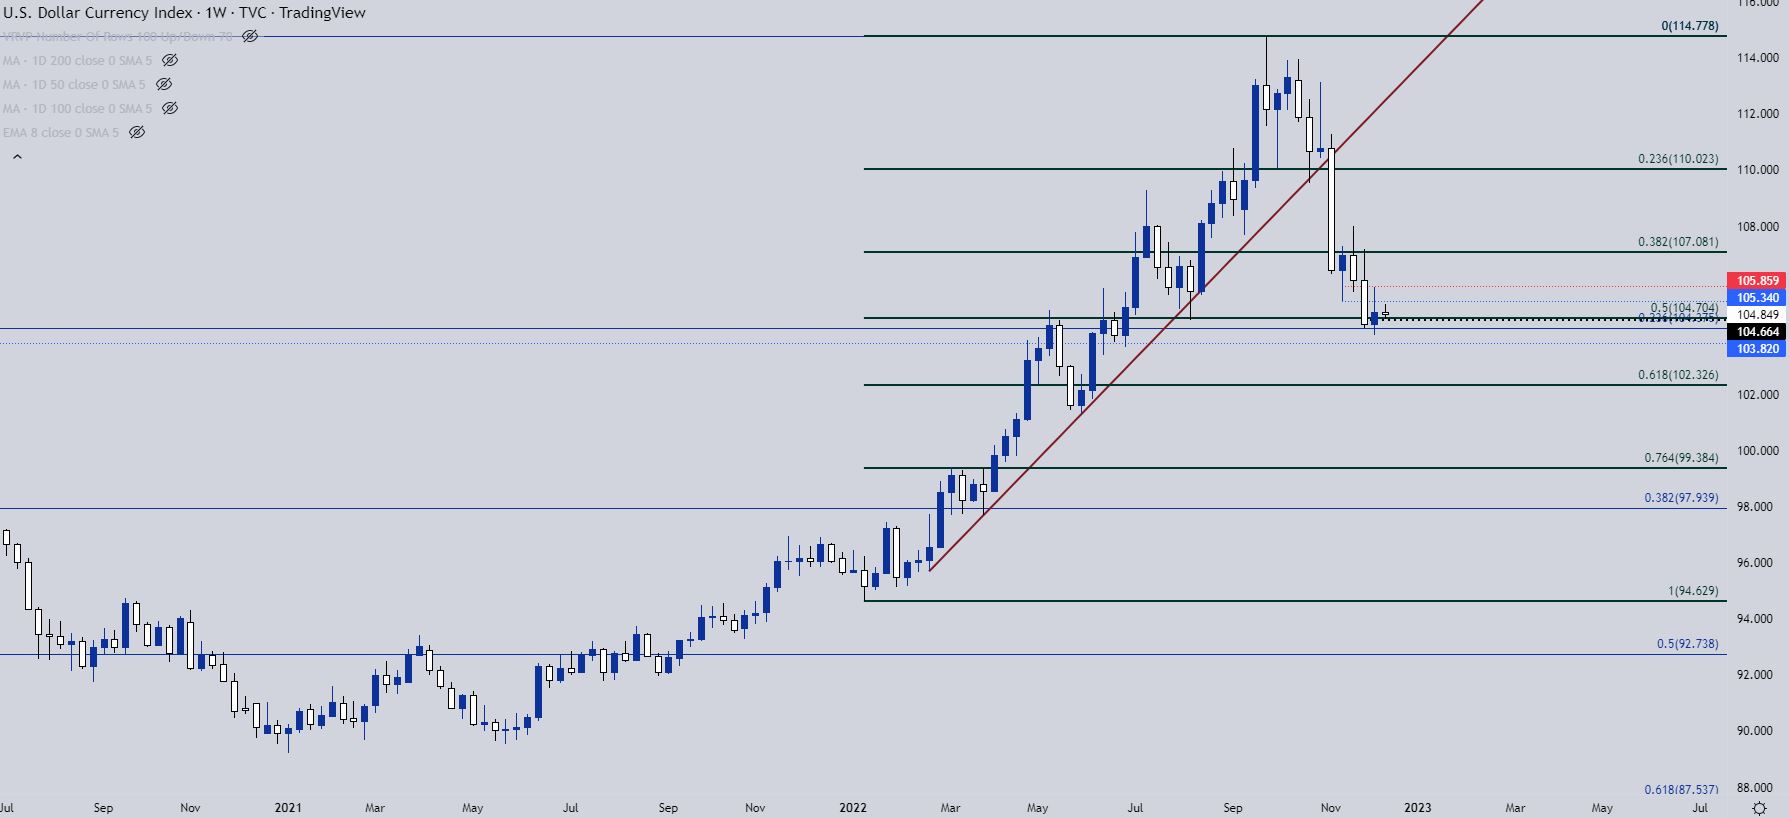
Chart prepared by James Stanley; USD, DXY on Tradingview
USD Shorter-Term
From the daily chart, we can get a better view of that recent support test and this is also where some price action deduction begins to come into play.
Last Monday brought a lower-low after the support test at the longer-term Fibonacci level. That led into a bounce, and price rallied all the way until running into the 200 day moving average, at which point sellers took another swing. It’s what’s happened after that that’s of interest, as price has since pushed down to the shorter-term Fibonacci level at 104.70 and is now finding support, setting up a possible higher-low.
And over the past few weeks, this lagging bearish behavior at support or upon tests of lows has led to a falling wedge, which is often approached with the aim of bullish reversals.
For levels – the 200 day moving average remains pertinent and this is now confluent with a price swing that I’m tracking around 105.86. A touch above that gives a short-term higher-high, which would open the door for a test of the upper trendline of the wedge.
US Dollar Daily Price Chart
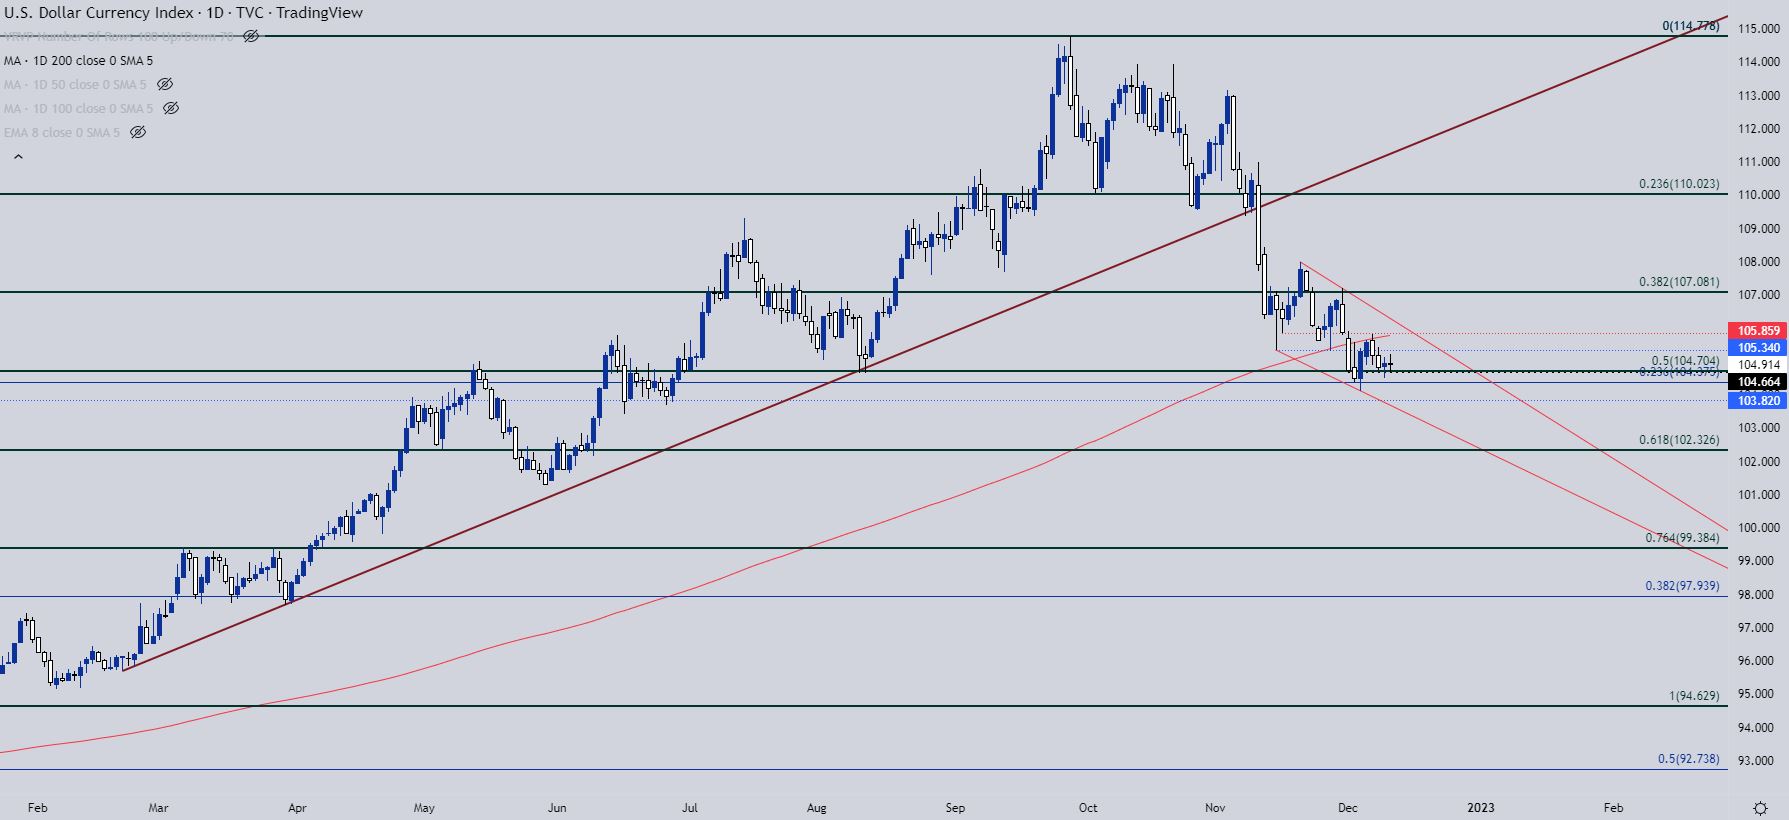
Chart prepared by James Stanley; USD, DXY on Tradingview
EUR/USD
I’ve said this quite a bit over the past year and it’s worth saying again if looking for some element of support to play out in the US Dollar, but, if the USD is going to embark on any trend changes, it’s going to need some help from the Euro.
The DXY instrument is 57.6% allocated towards the Euro so that surging trend in the first nine months of this year in USD was very much pushed along by a similar but mirror image trend in the Euro.
The Euro was falling out of bed as massive inflation ran through the economy but, unlike the US, there wasn’t a significant amount of growth, thereby constraining policymakers who didn’t feel they had the same ability to tighten the monetary backdrop as what showed in the US. But, the ECB has come to the table over the past quarter with rate hikes and Thursday is expected to bring another 50 basis point move.
There’s also been a shift away from the fear around European energy prices. With Europe previously getting a significant amount of energy from Russia, the ongoing war brings that into question and this puts the continent in a position of vulnerability. This was one of the driving forces of the currency throughout the summer, which as I highlighted in October, appeared to be shifting.
Shortly after, EUR/USD popped above parity, and bulls have been driving ever since.
From the weekly chart, EUR/USD just ran into a confluent spot of resistance. The 1.0579 level is a Fibonacci level of note that helped to catch the high last week. But, there’s also a bearish trendline here, taken from highs in May of last year and February of this year. That projection caught the high last week, confluent with the 1.0579 level, and that led to the build of a doji on the weekly chart.
This keeps the door open for pullback potential, as that resistance in EUR/USD meshes with the support test looked at in the US Dollar above.

EUR/USD Weekly Chart
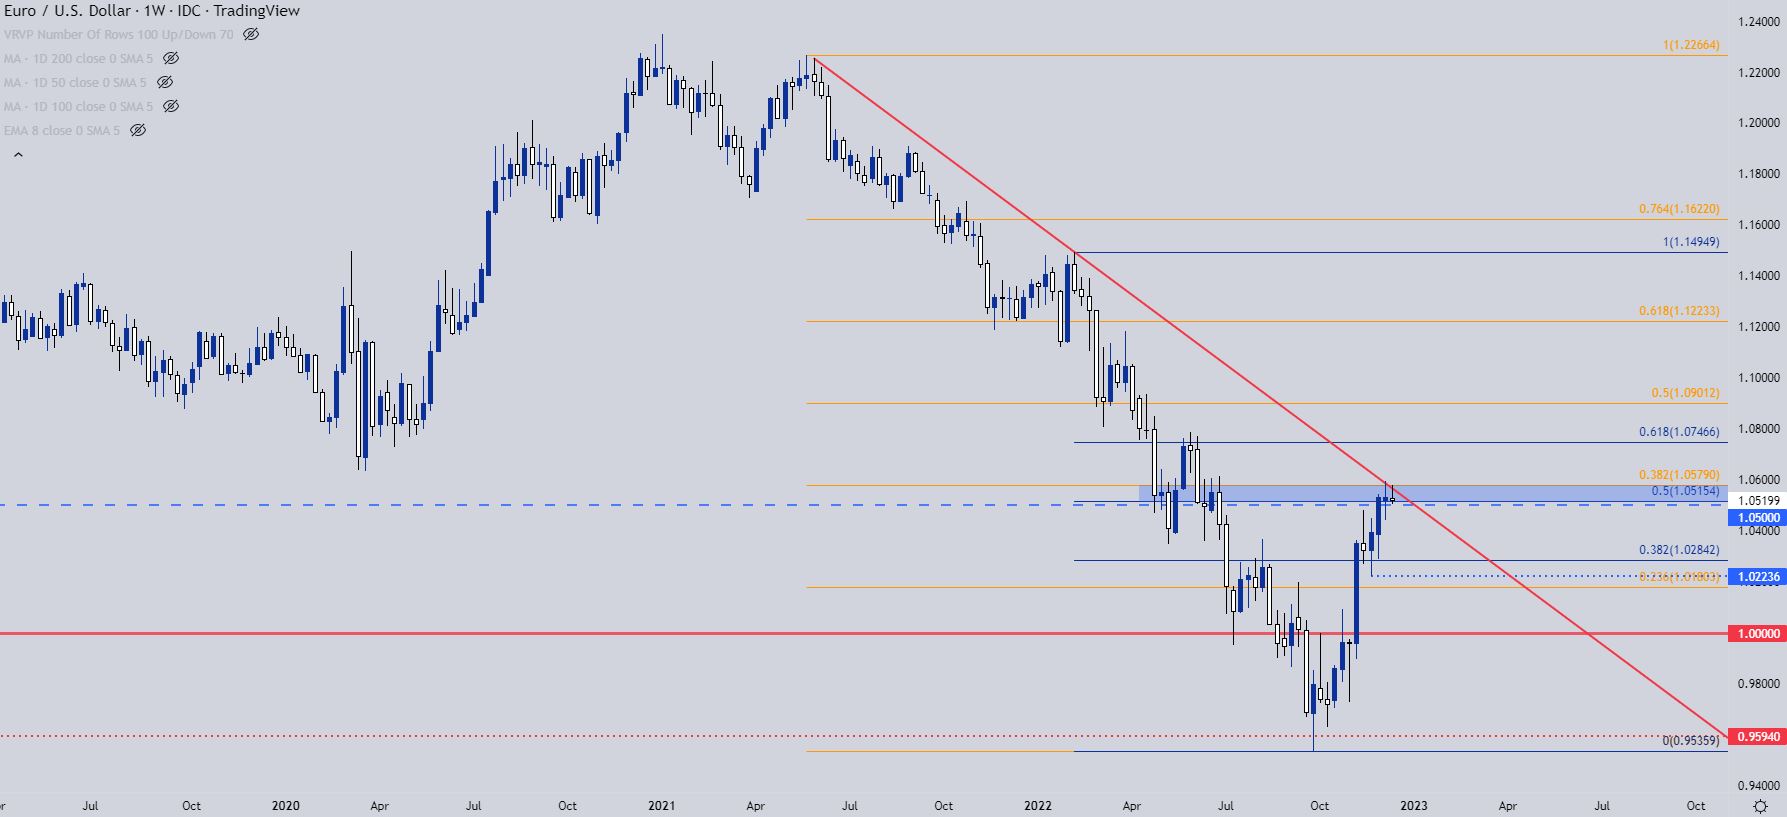
Chart prepared by James Stanley; EURUSD on Tradingview
GBP/USD
There’s a similar dynamic in GBP/USD at the moment. Resistance there continues to show at the 1.2303 level, which is the 50% mark of the May 2021 – September 2022 major move. This level started to come into play two weeks ago and it held the high through last week.
The pullback from that high found support at the 200 day moving average, however, before price popped back-up to re-test 1.2303. A hold at this level, thereby establishing a lower-high, keeps the door open for pullback potential.
GBP/USD Daily Chart
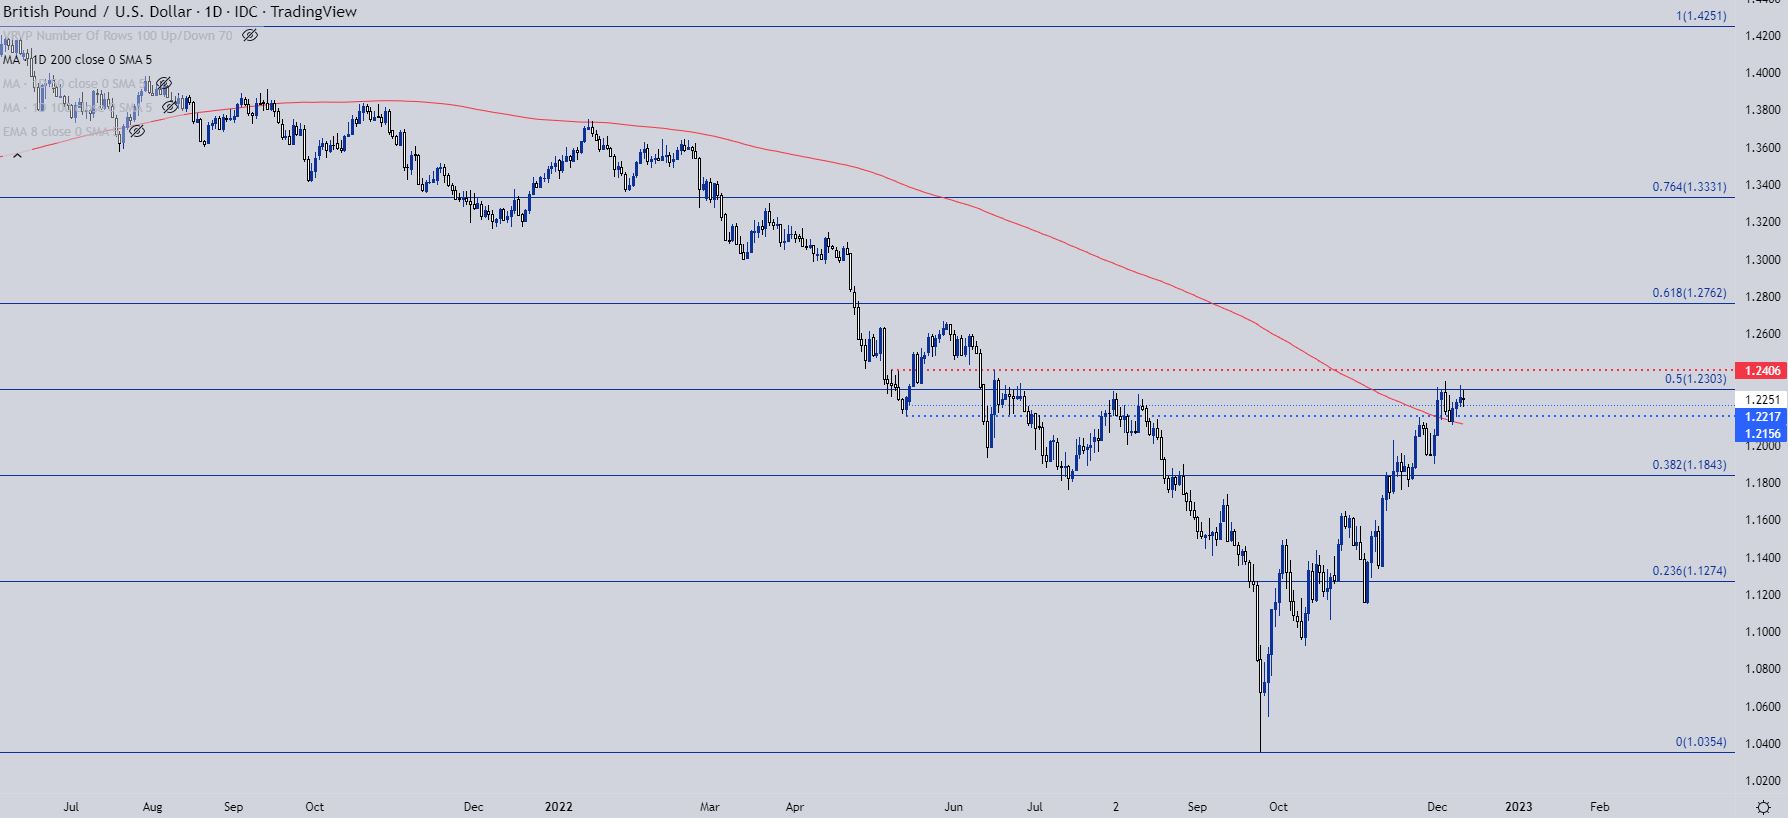
Chart prepared by James Stanley; GBPUSD on Tradingview
USD/CAD Resistance
The Canadian Dollar has been extremely weak. While the above daily chart of USD shows a fairly clear trend that’s consolidating into a rising wedge, USD/CAD has shown USD-strength as CAD-weakness has far outpaced that of the USD. There’s even an ascending triangle-like setup showing right now, with a brisk pace of higher-lows matched with a horizontal level of resistance at a long-term Fibonacci level. The price of 1.3652 is the 61.8% retracement of the 2020-2021 major move.
That level held the highs from Thursday through Friday of last week, with corresponding support showing at a familiar spot around 1.3578. If bulls can force the break beyond 1.3700, the next spot of resistance is at the next big figure on the chart, around 1.3800.
USD/CAD Daily Chart
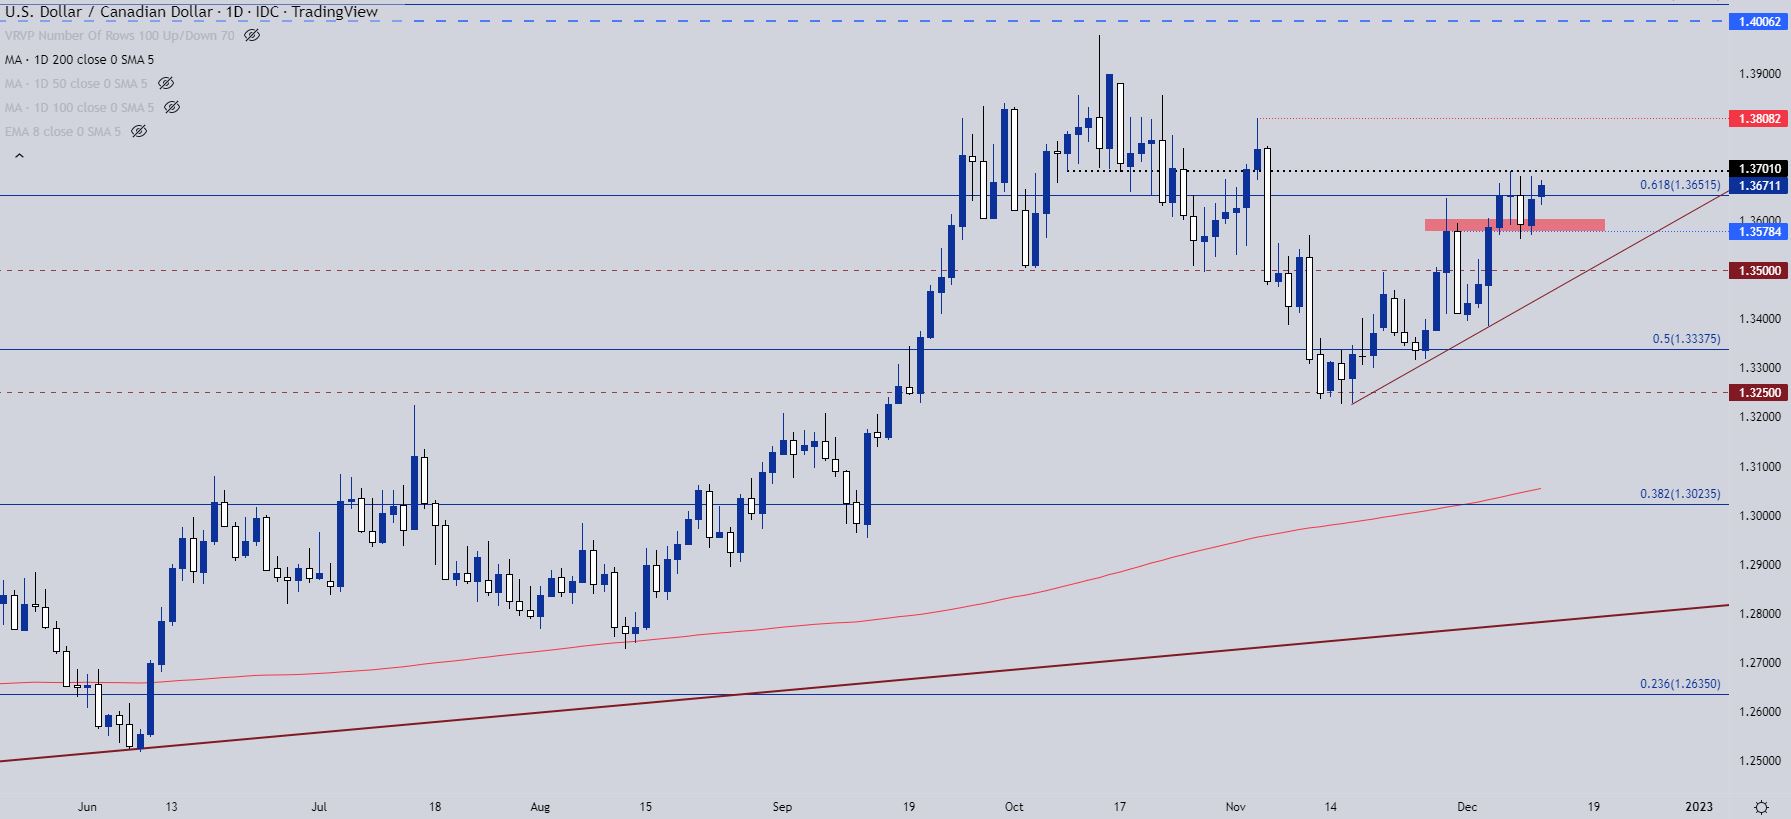
Chart prepared by James Stanley; USDCAD on Tradingview
USD/JPY
USD/JPY carries a similar look as the USD with a touch of additional JPY weakness. There’s a similar falling wedge formation that’s built over the past few weeks and while the USD in the above setup hasn’t yet encountered its resistance trendline, USD/JPY has already made that move. This comes after a higher-low printed at a key area on the chart, taken from the resistance-turned-support zone around 135.58. If price can breach last Wednesday’s high, there’d be a higher-high to match with that higher-low, and this would start to open the door for bullish scenarios in the pair.
The big level for bulls to face in USD/JPY is the 140 psychological level. For longer-term bullish trends, this would be the spot that needs to be re-claimed to open the door to big picture bullish continuation scenarios.

USD/JPY Daily Price Chart
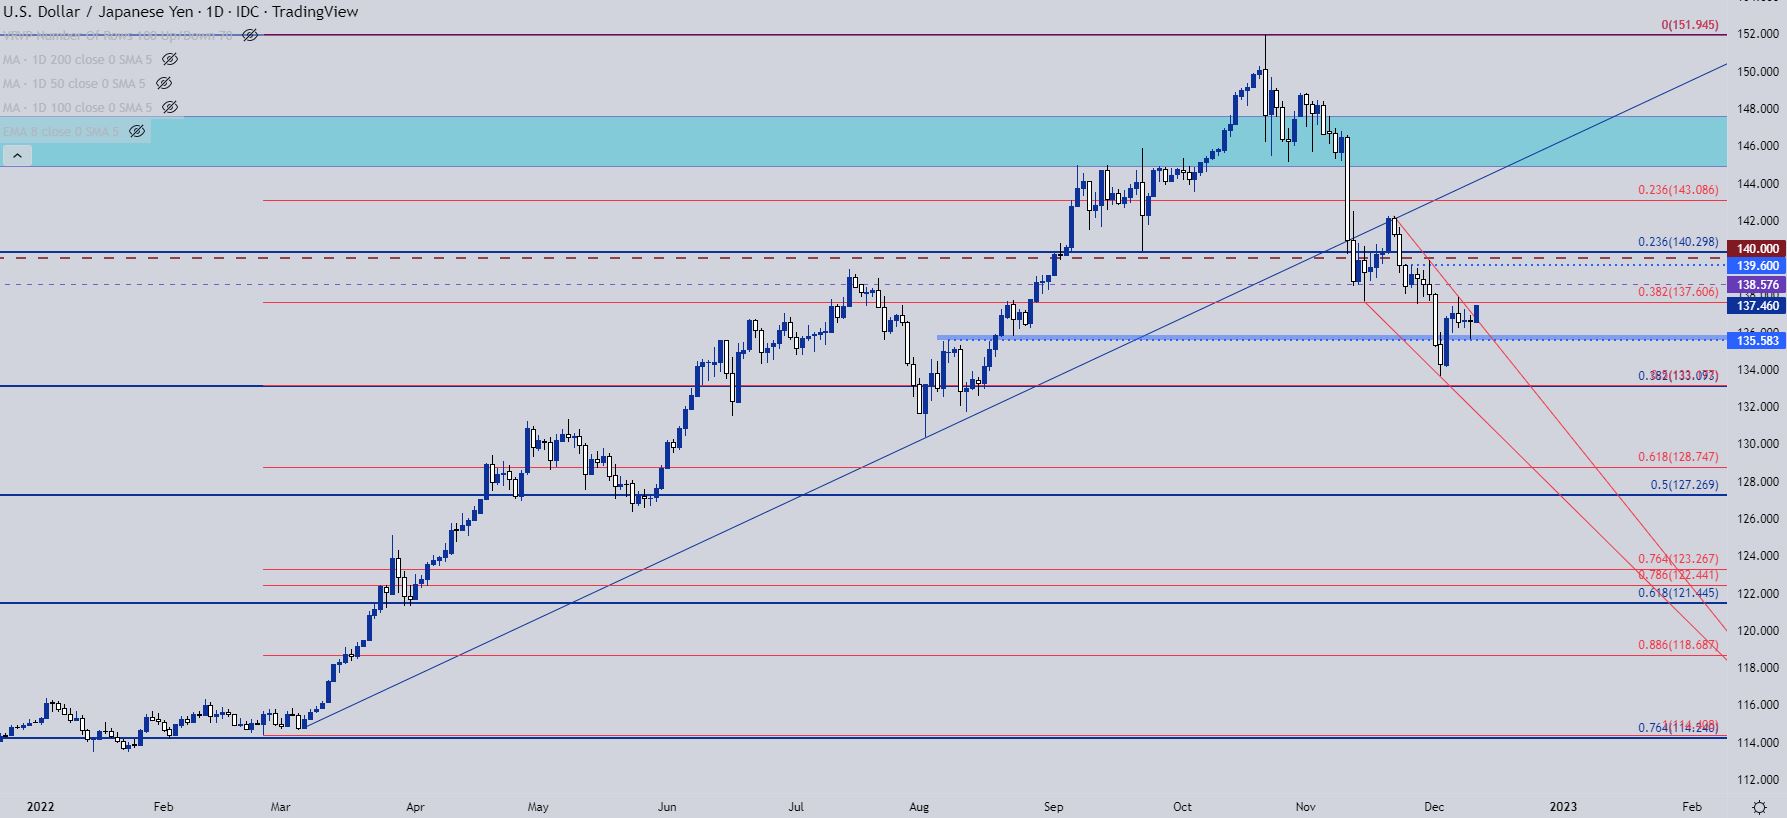
Chart prepared by James Stanley; USDJPY on Tradingview
--- Written by James Stanley, Senior Strategist, DailyFX.com & Head of DailyFX Education
Contact and follow James on Twitter: @JStanleyFX


