


US Dollar Talking Points:
- The US Dollar has pulled back from the fresh 19-year-high that was set last Thursday.
- EUR/USD has bounced from parity and the focus is squarely on the ECB for tomorrow’s rate decision – and that can drive USD trends ahead of next week’s FOMC rate decision.
- The analysis contained in article relies on price action and chart formations. To learn more about price action or chart patterns, check out our DailyFX Education section.
- Quarterly forecasts have just been released from DailyFX and I wrote the technical portion of the US Dollar forecast. To get the full write-up, click on the link below.

The US Dollar has pulled back after last week’s jump to fresh 19-year-highs. As I had written last Thursday, this was taking on more of a EUR/USD-driven theme. After the major pair ran into parity last week, buyers were unable to stem the declines and last Thursday morning saw a troubling break-below the big figure in EUR/USD.
This week saw European inflation print over 8% again (8.6%, to be exact) and core inflation printed at the same 3.7% as last month. As of now, the ECB is still sitting on negative rates, which doesn’t make a lot of sense given the levels of inflation being seen in the Euro-zone.
And this problem has potential to create even more problems, as a falling Euro will prod inflation even-higher as imported products to the Euro-Zone are more expensive on a relative basis. At some point, the ECB needs to step up with tightening or the US needs to cool down, because as long as this divergence holds and the USD draws capital flows from Europe to capture those new, higher rates, the European economy remains in a vulnerable spot and the repercussions of that falling currency will likely show in the coming months. And, could even offset tightening efforts from the ECB, particularly if we’re seeing this 8% inflation addressed by 25 basis point rate hikes.
Which brings us to the recent driver that’s helped both the USD to pullback as EUR/USD has put in some run, and that’s the building expectation for a 50 bp hike at tomorrow’s rate decision. Of course, its become fashionable for Central Bankers to surprise to the upside on rate hikes, as we saw the Bank of Canada going for 100 bps earlier this month following the Fed’s first 75 bp move in over 25 years.
The bigger question is what follows that: Will a 50 bp hike signal an ECB that’s more ready to address inflation? Or, will the bank remain loose and passive, instead pitching off tomorrow’s hike as a ‘one off’ or the start of a slow and methodical hiking cycle? If the ECB can convince that they’re ready to take inflation head-on by continuing to hike rates after tomorrow, then the topside move in EUR/USD could stick around for a bit, although that may need to wait for the FOMC rate decision a week from now.
The US Dollar
The US Dollar has now pulled back for three consecutive days, helped along by a EUR/USD that finally found some support off of the parity psychological level. And that support is showing at an interesting spot, at the 38.2% Fibonacci retracement of the 1985-2008 major move, plotted at 106.61. And there’s a deeper support zone, taken from prior resistance, plotted from around 105.52-105.79.
US Dollar Two-Hour Price Chart
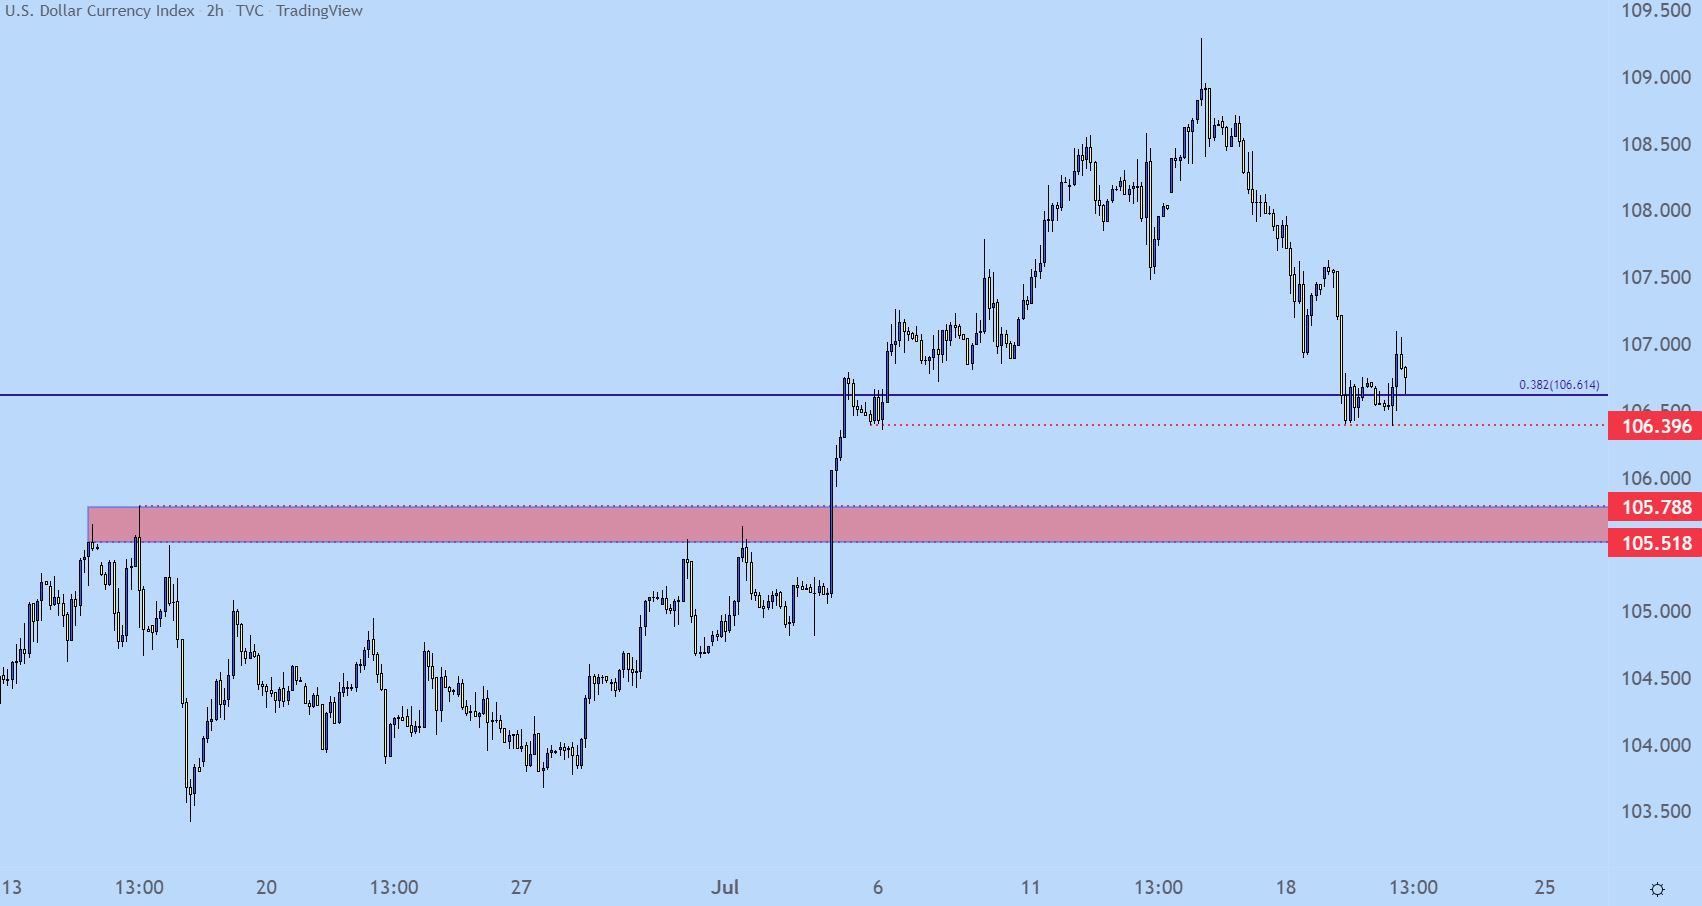
Chart prepared by James Stanley; USD, DXY on Tradingview
USD Longer-Term
The below monthly chart highlights the Fibonacci retracement that produced the level currently helping to hold the low at 106.61.

US Dollar Monthly Price Chart
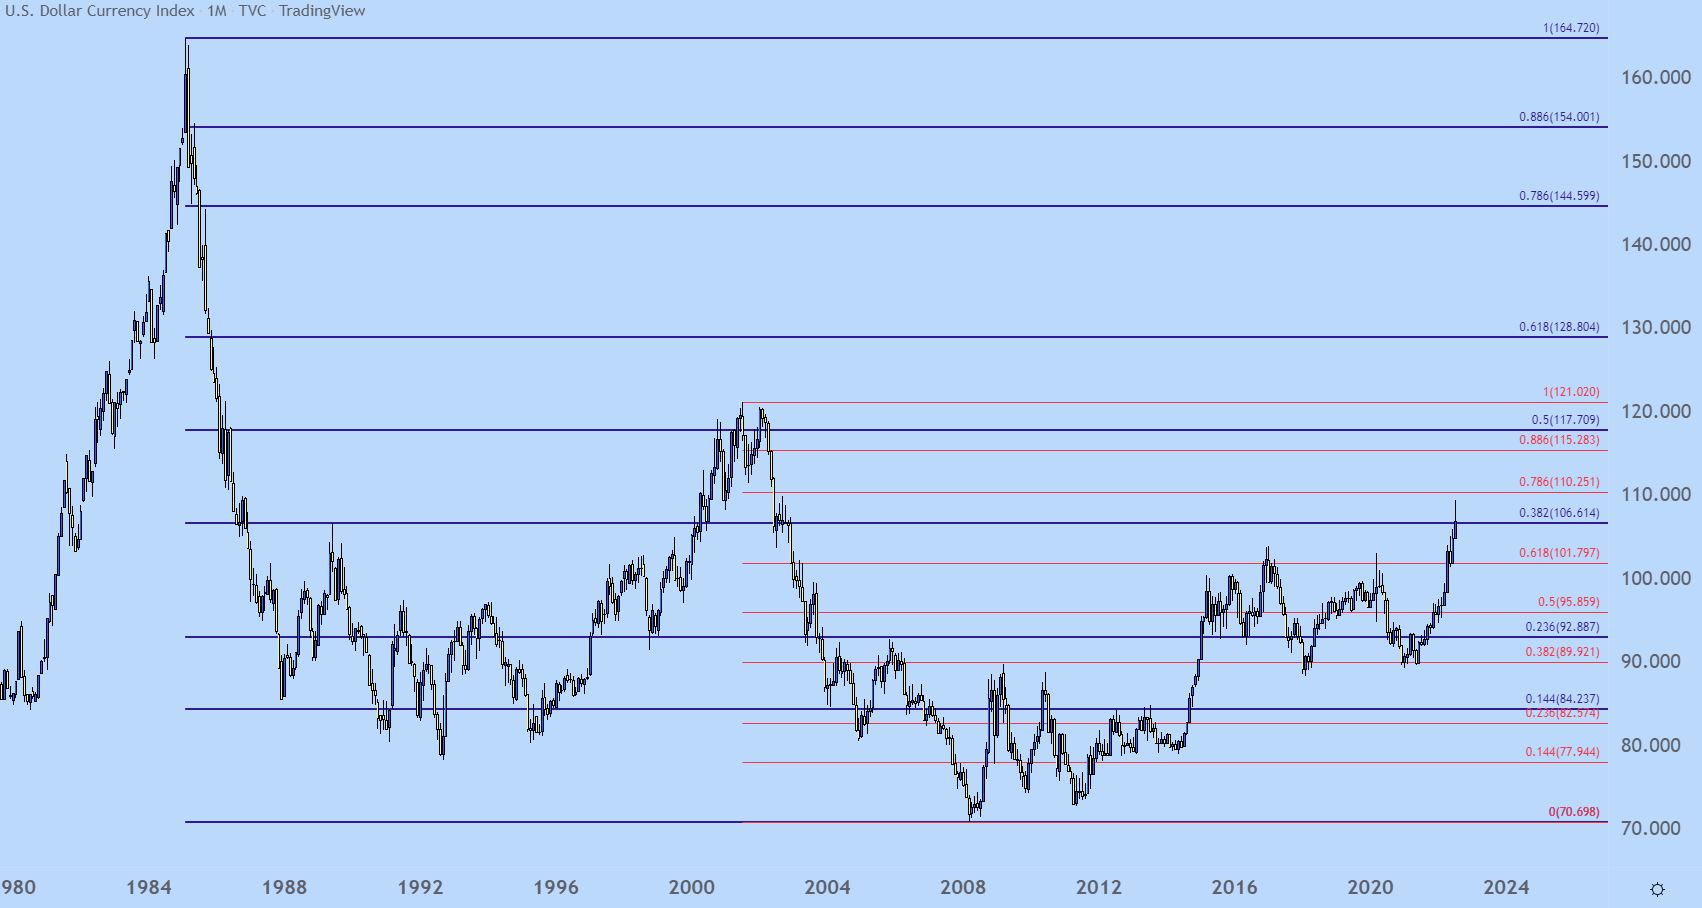
Chart prepared by James Stanley; USD, DXY on Tradingview
EUR/USD
EUR/USD has seen a bit of recovery ahead of tomorrow’s ECB rate decision, and this happened even despite that inflation print yesterday remaining in extreme-high territory. The move here appears to be a combination of short-cover ahead of tomorrow’s rate decision with what could be some legitimate bottom-picking, from traders looking to play a further parity defense theme.
At this point, EUR/USD is sticking around the levels that I had looked at on Thursday, with resistance showing around the 1.0235 area and support coming in at prior resistance, taken from around 1.0192.
There’s another spot of possible resistance a little-higher on the chart, and this is around the prior low of 1.0340. This spans from 1.0357-1.0387, and this could be an interesting spot for lower-high resistance potential. And if that can’t hold, if buyers are able to push an advance after tomorrow’s rate decision, there’s another zone of interest from around 1.0609-1.0640.

EUR/USD Two-Hour Price Chart

Chart prepared by James Stanley; EURUSD on Tradingview
GBP/USD
When I looked at USD pairs last Thursday, I remarked that GBP/USD was attractive for counter-themes, largely on the basis of a falling wedge formation that had built.
That falling wedge filled in and prices ran right up to the next point of resistance, plotted around prior support in the 1.2000-1.2021 area. Since then, however, buyers haven’t been able to break much ground, and resistance has continued to hold around that spot. The ensuing pullback has found support at 1.1968, which I had looked at yesterday.
At this point, that resistance remains vulnerable and if bulls can pose a re-test, there’s breakout potential with focus up to next resistance around 1.2090.

GBP/USD Two-Hour Price Chart

Chart prepared by James Stanley; GBPUSD on Tradingview
AUD/USD
The RBA took on a hawkish tone and that’s helped to bring the Aussie back to life. AUD/USD has put in a strong reversal move so far this week, similarly breaking out of a falling wedge formation. Such formations are often followed with the aim of bullish reversals and, so far, that’s continued to fill-in on AUD/USD.
For that theme to continue, we’ll need to see higher-low support, and there’s a spot of prior short-term resistance, taken from around .6850, that remains of interest for such an approach.

AUD/USD Four-Hour Chart

Chart prepared by James Stanley; AUDUSD on Tradingview
USD/CAD Breakout Slammed Back
Last week was a wild one in USD/CAD. The Bank of Canada unexpectedly hiked rates by 100 basis points which brought a quick bid to CAD and a leg-down in USD/CAD.
But, the pair found support at 1.2950 and the day after saw the USD spike, as EUR/USD was plunging below parity, and that allowed for a massive reversal in USD/CAD that brought in a fresh yearly high. Since then, however, the pair has faded-out all of that spike and then some, with prices currently sitting at a weekly low, trying to hold support above the 1.2850 level.
For next resistance – look to that prior support, from the approximate 1.2933-1.2950. For support, a breach of 1.2815 opens the door for a move to 1.2750.
USD/CAD Four-Hour Price Chart

Chart prepared by James Stanley; USDCAD on Tradingview
--- Written by James Stanley, Senior Strategist for DailyFX.com
Contact and follow James on Twitter: @JStanleyFX


