


US Dollar, EUR/USD, GBP/USD, USD/CAD, AUD/USD Talking Points:
- It was another week of strength for the USD, further clawing back losses from last Friday’s Omicron-fueled sell-off.
- EUR/USD, GBP/USD and AUD/USD are nearing key inflection points on the chart. This doesn’t preclude a continuation of USD-strength, but Dollar bulls are going to need to make a big show next week to continue the trend without pulling back first. And given all of the drivers in the headlines, that potential certainly exists.
- The analysis contained in article relies on price action and chart formations. To learn more about price action or chart patterns, check out our DailyFX Education section.

This morning brought another disappointing NFP print into the mix, with the headline number for November printing at 210k v/s the expected 550k. Average Hourly Earnings also disappointed, coming in at 4.8% against the 5% expectation.
On the positive side, the unemployment rate dropped down to 4.2%, which is below the Fed’s 4.5% marker for maximum employment. This is what the bank has been talking up over the summer regarding policy shifts, with the FOMC saying that they wanted to see maximum employment before tightening policy, even with inflation raging over the past six months.
Well, now maximum employment is here. The Fed had previously said that they want to see some consistency with this, so their move to a more-hawkish stance likely won’t function like a light switch, although this does open the door for a hawkish outlay at the December FOMC rate decision, assuming, of course, that Omicron hasn’t created a larger worry ahead of that meeting.
In the US Dollar, this morning’s release provided some volatility into the mix. The initial reaction was sizable and bearish, but support held from a cluster of Fibonacci levels around the 96 handle before recovery ensued, and at this point, the Greenback is trading at a three-day-high.
I remain bullish in USD, as I shared on Tuesday in the webinar. At this point, that theme is nearing a rigid test as each of EUR/USD, GBP/USD, AUD/USD and USD/CAD are nearing major inflection points on the chart. For the USD strength theme to continue, we’re going to need some support breaks in EUR/USD, GBP/USD and/or AUD/USD while each of these markets sit at significant levels, discussed below.
US Dollar 30 Minute Chart
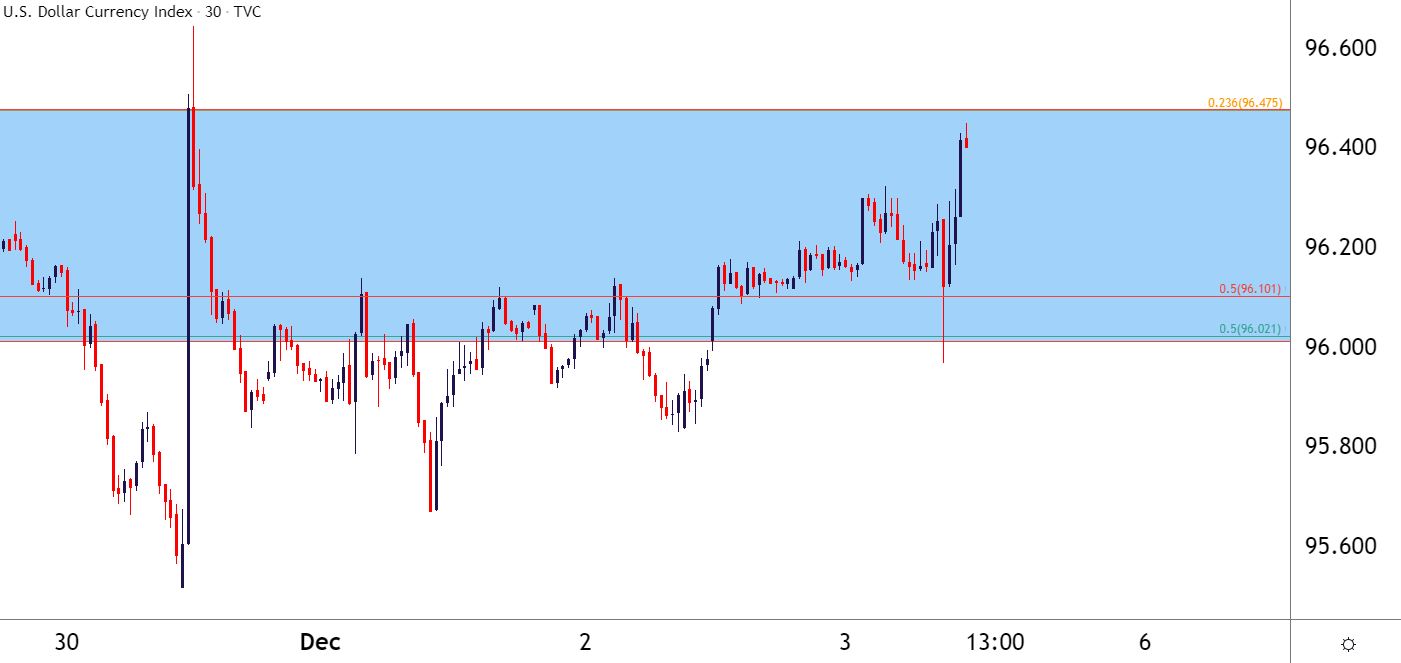
Chart prepared by James Stanley; USD, DXY on Tradingview
Taking a step back to the daily chart, and we can see where this week has largely been a support hold around a big spot on the chart, and after the bearish move last Friday, this is key for bulls. At this point, the 96.47 level remains as near-term resistance. This was the final target from the Q4 technical forecast in the US Dollar, and comes from a longer-term Fibonacci retracement.

US Dollar Daily Price Chart
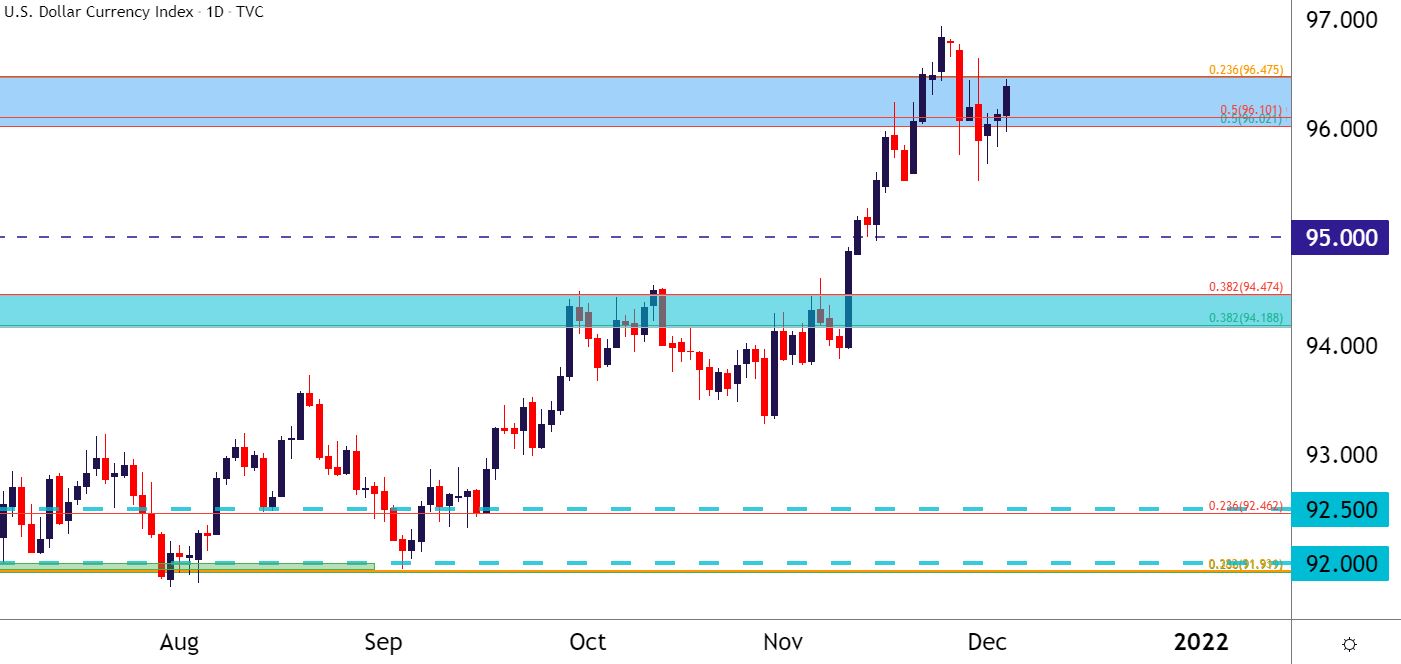
Chart prepared by James Stanley; USD, DXY on Tradingview
EUR/USD
EUR/USD remains above a big spot of support. This week saw a stronger-than-expected inflation print out of Europe, which gave a quick jolt of strength on Tuesday. It’s been a slow burn since then.
Underneath price action is a significant support zone, plotted from 1.1187-1.1212.
EUR/USD Daily Price Chart
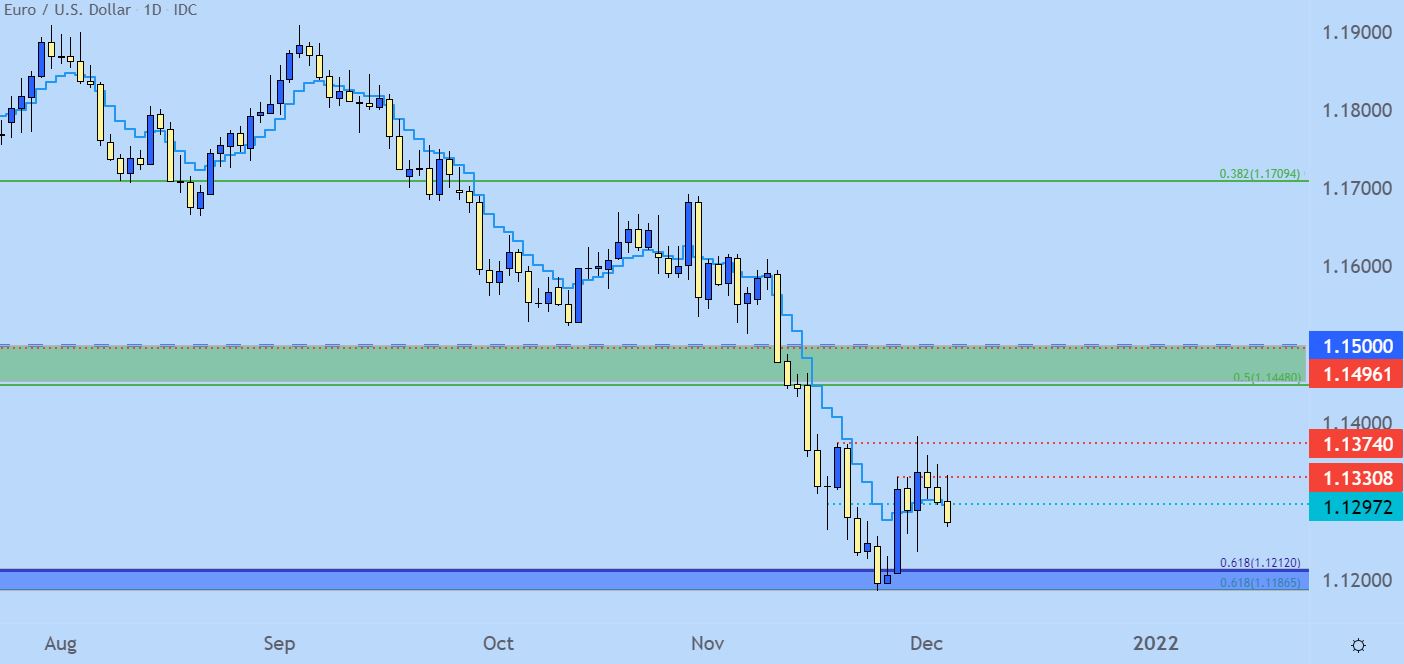
Chart prepared by James Stanley; EURUSD on Tradingview
GBP/USD
I had looked into Cable yesterday, highlighting a series of wicks sitting atop candles on the daily chart, highlighting a hold of near-term resistance. The pair has since turned over, broken through the 3250 psychological level, and is making a fast move towards a significant point of support, as well. The 2021 low comes in right at the bottom of a bear flag formation, which is also very near a long-term Fibonacci level at 1.3167.
GBP/USD Daily Price Chart
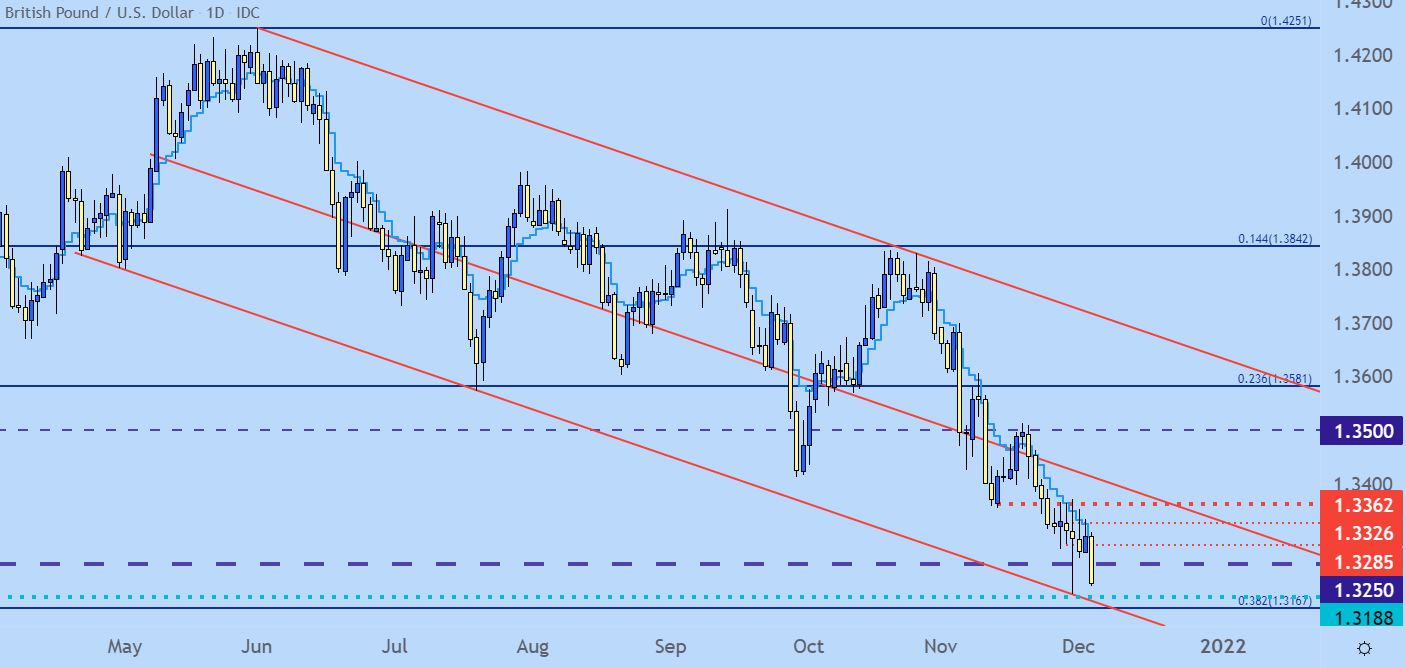
Chart prepared by James Stanley; GBPUSD on Tradingview
USD/CAD
I had warned of a pullback here yesterday, similarly taken from a series of wicks sitting atop price action as prices remained near a key zone of short-term resistance.
This morning’s reaction allowed for USD/CAD to push down to the 1.2750 level, at which point bulls responded. The breakout potential remains here for next week, looking to the 1.2850 level.
USD/CAD Four Hour Price Chart
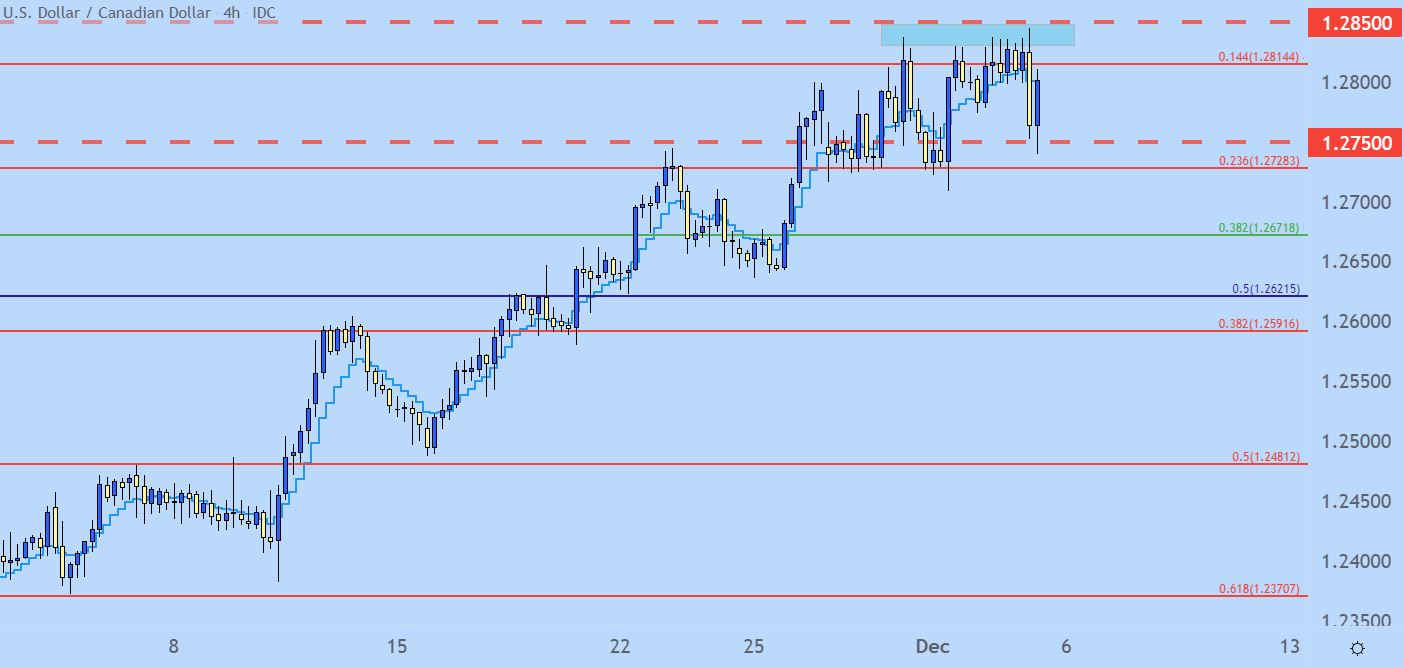
Chart prepared by James Stanley; USDCAD on Tradingview
AUD/USD Bear Flag Fills
I’ve been bearish on AUD/USD for some time now, and in November, I highlighted a bear flag formation that had built. That trend has continued to break down, and at this point, a very oversold AUD/USD is nearing a key spot on the chart at the .7000 psychological level. This is a price that’s exhibited a number of inflections in the past, most recently November of last year, which led to a 1,000 pip incline.
AUD/USD Daily Price Chart
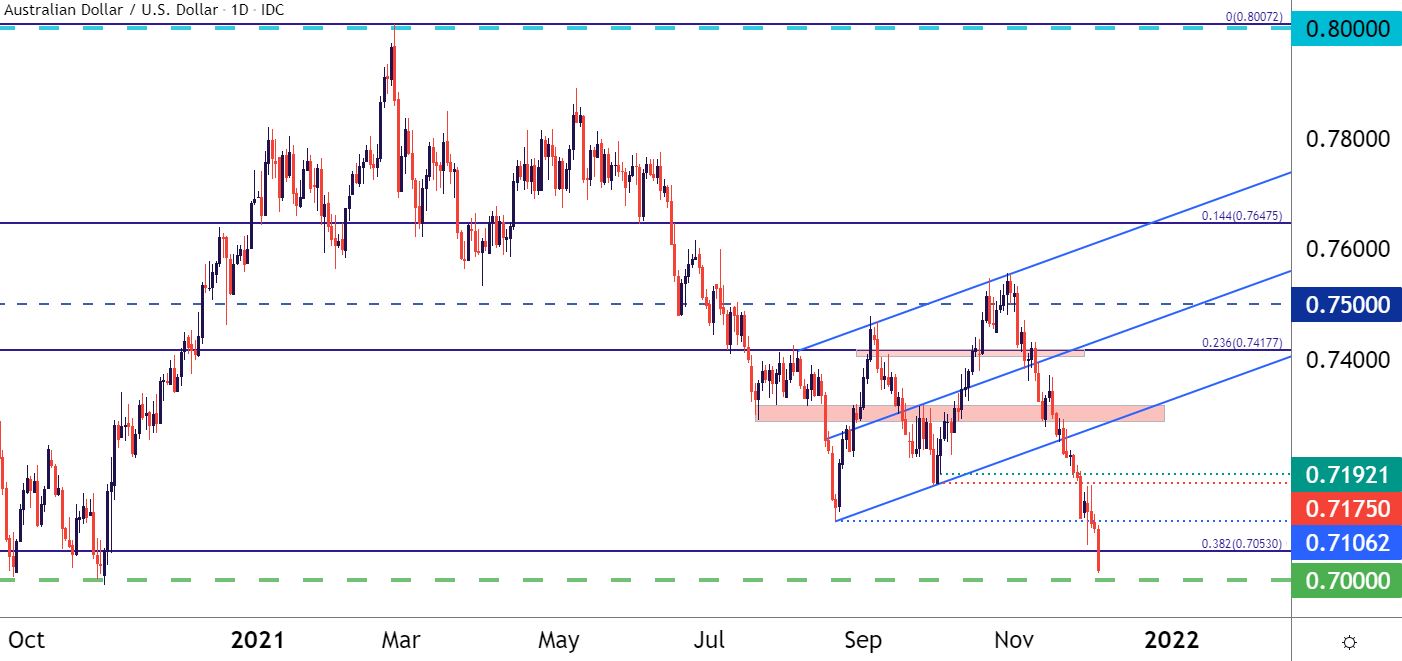
Chart prepared by James Stanley; AUDUSD on Tradingview
--- Written by James Stanley, Senior Strategist for DailyFX.com
Contact and follow James on Twitter: @JStanleyFX


