


US Dollar Pre-CPI Talking Points:
- Headline inflation is expected to print at an annualized rate of 5.8% tomorrow.
- This would be the 8th consecutive month of above-target inflation, and the sixth consecutive month in which inflation comes in above 5%.
- Below I look at various scenarios in USD, EUR/USD, GBP/USD and USD/JPY around tomorrow’s inflation data.
- The analysis contained in article relies on price action and chart formations. To learn more about price action or chart patterns, check out our DailyFX Education section.

The US Dollar has continued to pull back after last week’s FOMC rate decision. Once again, the Fed sounded really dovish and Powell refused to even entertain the topic of rates. He did continue to say, however, that the bank is continuing to drive for maximum employment before making any changes to policy, even with inflation remaining at very high levels that the Fed still thinks are transitory in nature.
So while markets had started to price in more than one hike next year from the FOMC, since last week’s rate decision the 10-year has given up as much as 19 basis points. This is a pretty clear illustration of rate hike bets receding after another dovish FOMC outlay.
There is but one pressure point and that’s coming into the equation tomorrow with the release of CPI numbers from last month. The expectation is high, looking for headline CPI to bump up to 5.8%, which would be quite the jump from the 5.4% that’s printed for three of the past four months. That would also add another apex to the below chart that shows how aggressively high inflation has run above the Fed’s 2% target for six, going on seven months.
US CPI Since 2017

Chart prepared by James Stanley
US Dollar
So expectations are high for CPI tomorrow and despite the continued pullback in US rates, the technical posture of the US Dollar hasn’t really matched that: The USD continues to trade in the same range that’s held since late-September, when prices popped on the back of that FOMC rate decision (which led to rates markets getting ahead of themselves before last week).
This could be setting the table for deeper pullback potential, particularly if CPI prints inside of that 5.8% with even greater potential for a deeper bearish move should CPI come in at 5.4% or less. That would speak to the Fed’s ‘transitory’ narrative which could remove some additional pressure from the USD.
The other side of the argument: We’ve already heard from some FOMC officials starting to question the transitory nature or, at the very least, drawing a line in the sand at some point next year for when that might come into question should the data not reflect what they want it to. If inflation surprises to the upside here, that could lead to some very fast re-pricing in a lot of markets, rates and the USD included. That could be the motivation that USD bulls have been looking for to finally leave behind the resistance zone around the 94.50 level.
US Dollar Four-Hour Price Chart

Chart prepared by James Stanley; USD, DXY on Tradingview
US Dollar Longer-Term
Taking a step back on the chart and the recent range makes a bit more sense. That late-September post-Fed breakout propelled the USD into a major Fibonacci level at 94.47. A month-and-a-half later and that resistance is still holding the highs. On the side of support, there’s been a continued hold around a prior zone of resistance, from a previous ascending triangle that was setting up a couple of months ago. And there’s also a bullish trendline underneath price, helping to guide the move, which is essentially setting up another ascending triangle formation, which will often be approached with the aim of bullish breakouts, similar to what I had looked at during the prior scenario.
There’s not much for timing here, however, so the setup remains but the question is what could set the spark that shoots this higher?
US Dollar Weekly Price Chart

Chart prepared by James Stanley; USD, DXY on Tradingview
EUR/USD
I highlighted a deductive scenario in EUR/USD last week when the pair stubbornly refused to even test the 1.1500 psychological level. That’s led to a bounce this week and prices have already jumped up to the 1.1602 resistance area that I had been using previously.
That level has again helped to hold the high, so remains as resistance for now, but sellers have had all morning to make a move and as yet, haven’t, but this is likely due to the CPI release on the docket for tomorrow. Nonetheless, a bit higher is another spot of resistance at 1.1664, and that’s confluent with the resistance side of the falling wedge. If price action can beast through that level and up to the 1.1709-1.1736 zone, then stronger bullish potential will avail itself.
EUR/USD Daily Price Chart

Chart prepared by James Stanley; EURUSD on Tradingview
GBP/USD
So there’s a bit of two-way action in GBP/USD. I highlighted a double-bottom like setup last week as price action held support above the 1.3410 spot after a dovish Bank of England rate decision.
There’s also a longer-term bullish formation here, however, with the bull flag; and last week brought a wide-open opportunity for bulls to deal with that formation but, instead, with some help from the BoE they folded at a really big spot.
Prices in the pair are currently holding resistance around a Fibonacci retracement at 1.3575. If this holds overnight, it keeps the door open for bullish setups in the pair, particularly focused on USD-strength around tomorrow’s FOMC outlay.
GBP/USD Daily Price Chart
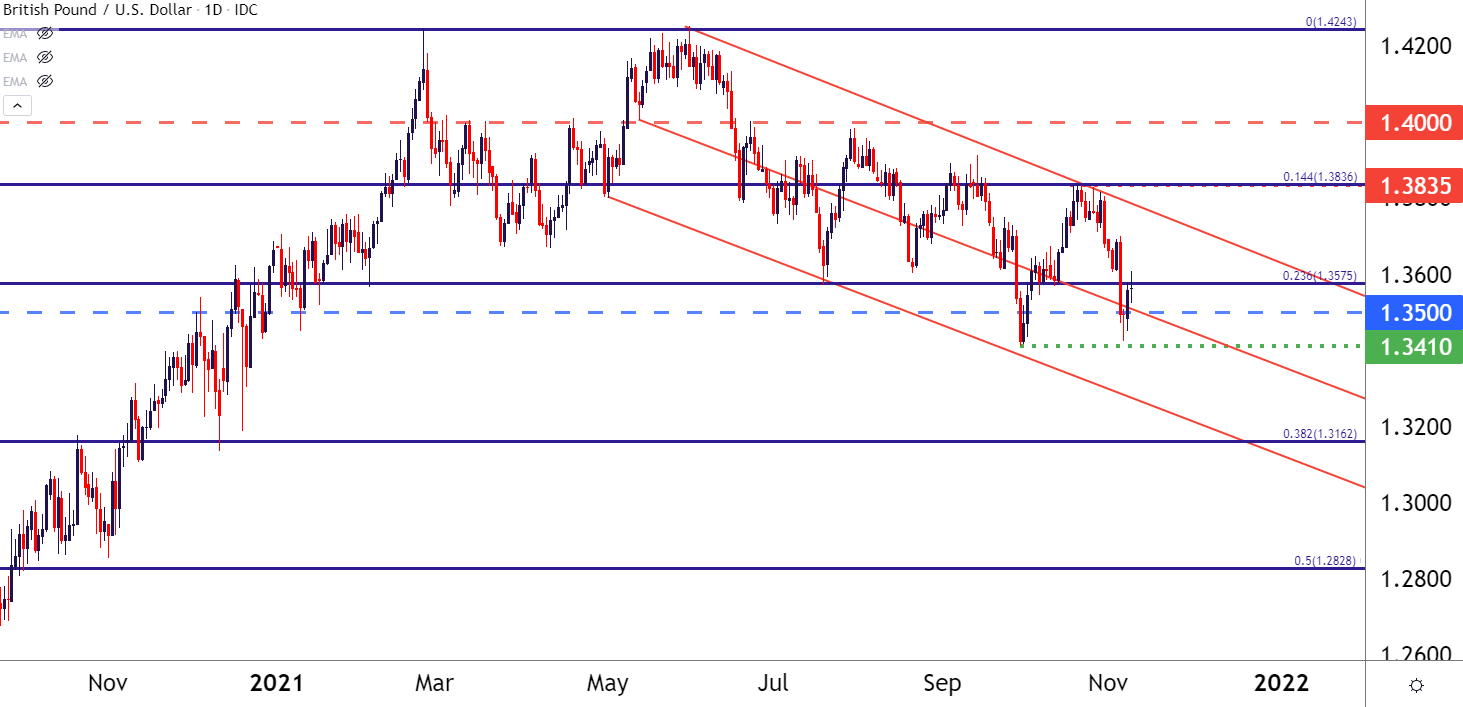
Chart prepared by James Stanley; GBPUSD on Tradingview
USD/JPY
Life happens fast in the Forex market.
USD/JPY is a pretty clear illustration of this. As rates were running higher after September FOMC, the Yen put in a massive move of weakness in a very short period of time. USD/JPY set a fresh four-year-high and perched near the 115.00 psychological level.
But after last week’s rate decision, there was much less motivation for higher rates themes and the pair started to set up in a descending triangle, which I highlighted on Friday.
The pair has since broken down to fill in that formation, and support is now showing around the 112.70 level.
This pair could be on the move in both scenarios: If CPI prints in-line or below expectations, additional UDS weakness could mesh with a continued pullback in rates. On the other hand, a beat in CPI that makes inflation look less transitory could bring the bid back to the USD, and USD/JPY as rates come back to life.
USD/JPY Four-Hour Price Chart

Chart prepared by James Stanley; USDJPY on Tradingview
--- Written by James Stanley, Senior Strategist for DailyFX.com
Contact and follow James on Twitter: @JStanleyFX


