


USD, EUR/USD, GBP/USD, USD/JPY, USD/ZAR Talking Points:
- Tomorrow brings the Fed, and Friday brings NFP. It’ll be a busy rest of the week around the US Dollar.
- The Greenback put in a strong bullish move after the September FOMC rate decision, and tomorrow is expected to bring a taper announcement but that already appears to be priced-in. What else can the Fed say to feed USD bulls and will Powell tip his hand towards a more hawkish outlook in the December Summary of Economic Projections?
- The analysis contained in article relies on price action and chart formations. To learn more about price action or chart patterns, check out our DailyFX Education section.

Tomorrow brings the Fed, and Friday brings Non-farm Payrolls, so we’re in the midst of some heavy drivers for the USD.
It’s long been expected that this is the rate decision at which the Fed will announce their intentions to begin tapering asset purchases. Many market participants were looking for that announcement at the September rate decision. Instead, Powell said that the ‘significant further progress’ that the bank wanted to see hadn’t yet been met on the employment front even though inflation was sticking above 5%. Powell said the bank was ready to make that taper announcement soon provided that employment data didn’t massively disappoint, and global markets largely inferred that to mean ‘November.’
The Fed did, however, upgrade their economic projections to highlight a potential rate hike in 2022. Since then rates markets have continued to run and are now closer to pricing in a second rate hike for next year. And the expectation for a taper announcement appears to be priced-in at this point, with the focal point now moving to the Fed’s rate hike plans for next year and whether they think they’ll need to usher in a faster pace of hikes to start stemming inflationary pressure.
The US Dollar shot-higher on the back of the September rate decision, rushing up to a fresh yearly high and eventually finding resistance at the 38.2% Fibonacci retracement of last year’s sell-off. This led to some ranging price action in early-October, with one more attempt to break out to a fresh high mid-month, only for prices to slide back to trendline support last week, at a spot that was confluent with the 23.6% retracement of the recent topside move.
Friday brought a big response to that confluent support as bulls hit the bid and USD put in a bullish engulfing formation. So far this week, that bullish trend has softened as prices have pulled back to support at the 14.4.% retracement of that same major move.
To learn more about Fibonacci, check out DailyFX Education
US Dollar Daily Price Chart
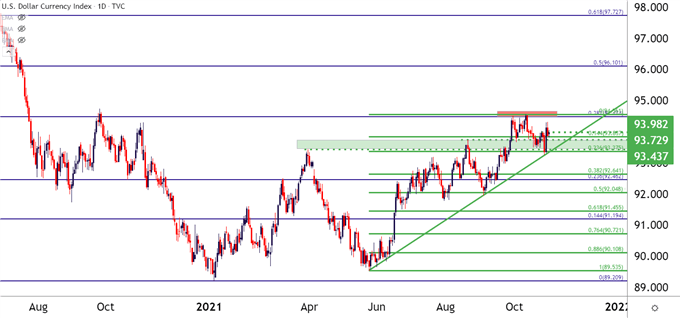
Chart prepared by James Stanley; USD, DXY on Tradingview
US Dollar Bigger Picture
Taking a step back on the chart and we can get some greater reference around current levels. That 38.2% retracement of last year’s sell-off held resistance for three consecutive weeks until, eventually, bears were able to push down to a fresh monthly low. But that’s around the time that confluent support came into play on Friday, leading to a strong continuation move that pretty much made the week for the Greenback.
Can buyers finally press through this Fibonacci resistance? And what will the Fed need to say to make that happen, considering that a taper announcement already appears to be priced in? Likely, the bank will need to warn of faster rate hikes next year to match the moves that have been showing in US rates, and that could bring some further bullish price action into the mix as markets further adjust to the potential for tightening from the Fed.
But, let’s be clear, with no updated projections due at tomorrow’s meeting, if this is to show it’ll likely emanate from innuendo or hints from Chair Powell. The Fed has went out of their way to support this equity market run and it seems unlikely that they’d choose right now to all-of-the-sudden pull the rug out from underneath these well-built trends. But once the start of tapering is in the rear view, the focus then moves on to rates and what Powell says on the topic tomorrow will be pored over for hints of a more-hawkish FOMC.
US Dollar Weekly Price Chart
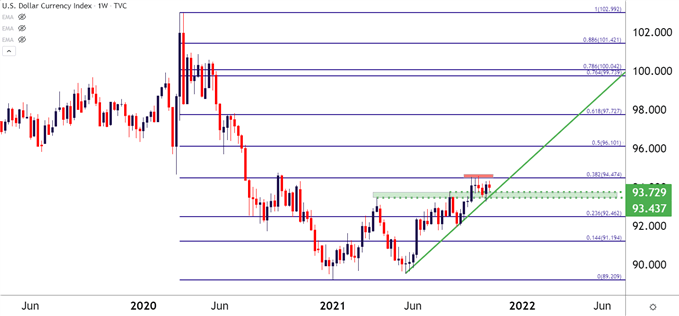
Chart prepared by James Stanley; USD, DXY on Tradingview
EUR/USD Still in Falling Wedge
If the US Dollar does put in a bearish reversal, there’s some context to work with that in EUR/USD, where the pair has been brewing a falling wedge formation for the past few months.
Falling wedges are often approached with the aim of bullish reversals and can oftentimes show up around a key area of support. As support grows nearer, sellers slow down and this leads to a weaker angle on the support trendline as compared to resistance.
The support area is clear, from around 1.1448-1.1500. And over the past five week’s we’ve seen a steady build of higher-lows, further pointing to the potential of a pullback in the bearish trend that may turn into more of a reversal-like setup.
The big question here is one of pairs selection; and because the Euro has been pretty weak, it may not be the optimal currency to mesh up with a weak US Dollar, at least in the current context. GBP/USD may be a bit more attractive for similar aims.
EUR/USD Weekly Chart
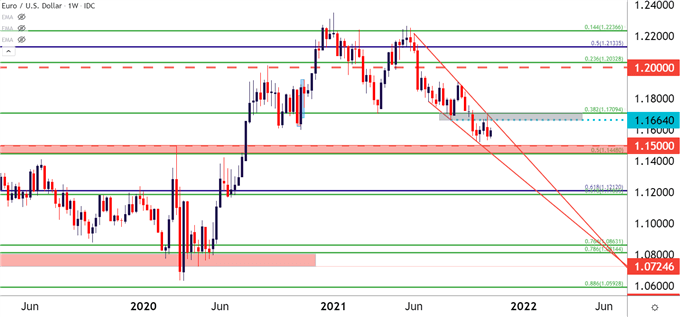
Chart prepared by James Stanley; EURUSD on Tradingview
GBP/USD
Perhaps more attractive, at least from a fundamental perspective, could be topside scenarios for GBP/USD, as the UK is another economy that’s looking at near-term rate hikes.
While the Fed was fairly lackadaisical towards inflation earlier this year, the BoE has been a bit more active, preparing to hike rates in response with markets expecting earlier hikes out of the Bank of England than the Fed.
And from the weekly chart below, while EUR/USD above has been harboring a sharp sell-off move since earlier this year, GBP/USD appears to be in a corrective phase, showing a bull flag formation. Last week saw another resistance inflection at 1.3836, which is confluent with the resistance side of that bull flag and prices have since tilted-lower.
This puts focus on 1.3575 as potential support, after which the 1.3500 psychological level comes back into play.
GBP/USD Weekly Price Chart
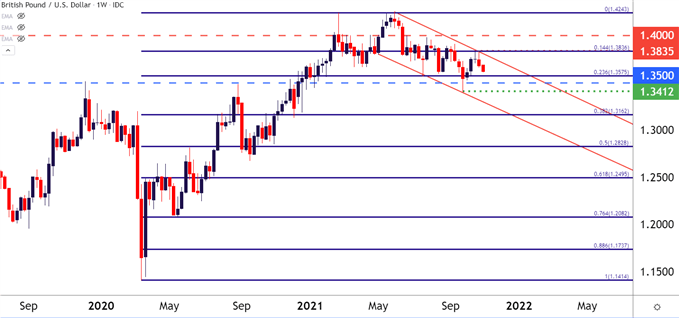
Chart prepared by James Stanley; GBPUSD on Tradingview
USD/JPY
If Powell does excite rates markets tomorrow, there’s one major focal point that FX traders will be looking at and that’ll be the Japanese Yen.
I had talked about this theme shortly after the September rate decision, warning that a more hawkish Fed meant a greater likelihood of rates markets getting to work, and given the Bank of Japan’s five years sitting on negative rates, there was the potential for carry trades to come back similar to what was seen in Q1 of this year.
USD/JPY and rates can track fairly well, with higher rates leading to more bullish behavior in USD/JPY as traders attempt to capture the new, higher carry rates as brought upon by increasing rates in the US.
And this can then lead to greater bullish behavior, which can lead to stronger up trends, making for a very symbiotic relationship, if and when it avails itself.
We had a show of that them through the first few weeks of October with USD/JPY jumping up to a fresh three-year-high. Since then, the pair has continued to coil and this has taken on the appearance of a falling wedge, which in this case appears to be functioning similar to a bull flag formation. That formation started to give way on Friday as the USD was building that bullish engulfing formation, but price action has since meandered back into the wedge. A hold above support at 113.17 keeps the door open for the bullish trend.
USD/JPY Four-Hour Price Chart
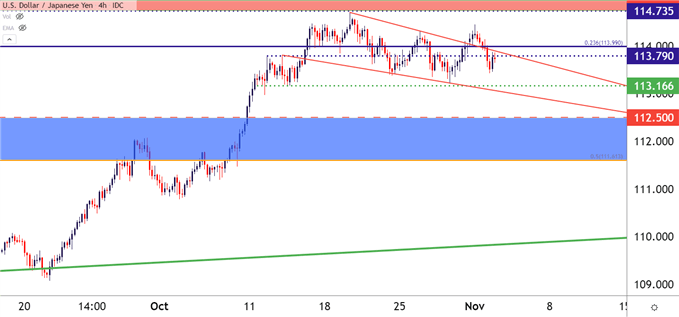
Chart prepared by James Stanley; USDJPY on Tradingview
USD/ZAR Highlighting Breakout Potential
There’s been some news on the South African Rand from earlier today, covered by my colleague Richard Snow, and while many USD-pairs have slacked off over the past couple of weeks, the exotic pair of USD/ZAR has continued to run with aggressive topside.
Prices are now testing another new level around seven month highs, taken from a long-term Fibonacci retracement. From the below chart, you can see the makings of an imperfect inverse head and shoulders formation that’s already starting to give way.
If we end up with a strong USD after tomorrow’s FOMC rate decision, the topside of USD/ZAR could be very interesting as the pair further recovers from last year’s losses.
USD/ZAR Daily Price Chart
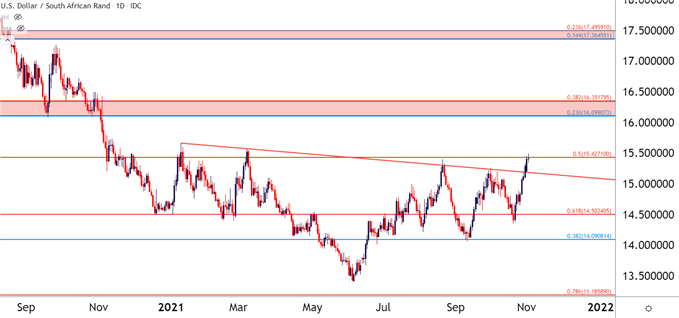
Chart prepared by James Stanley; USDZAR on Tradingview
--- Written by James Stanley, Senior Strategist for DailyFX.com
Contact and follow James on Twitter: @JStanleyFX


