


Gold, GLD, XAU/USD Talking Points:
- Gold prices are pushing up to a fresh weekly high, testing beyond a big spot of near-term resistance.
- As looked at last week, Gold prices began to re-engage with a big Fibonacci level while brewing a falling wedge formation, often followed with the aim of bullish reversals.
- The analysis contained in article relies on price action and chart formations. To learn more about price action or chart patterns, check out our DailyFX Education section.

It’s been a busy backdrop since the September open, with US equities giving back a large chunk of recent gains as a number of other items have taken the spotlight. During the month, problems at Evergrande began to rumble a bit more loudly and that situation is not solved yet. But, along the way we picked up a couple of additional risks: The Fed warned of possible rate hikes next year, which was surprising considering that they haven’t even made a formal taper announcement yet.
For that formal taper announcement, we heard from the Fed in September that they’re almost there, just waiting on data from the labor market to indicate that ‘significant further progress’ that they’ve been looking for. Powell had hinted that the taper announcement would come soon provided that jobs data didn’t massively disappoint, and there’s but one NFP report from when Powell made that statement to the November FOMC meeting, and that’s on Friday with Non-farm Payrolls.
And more recently, as in from today, oil prices have spiked up to a fresh six-year-high, crossing a gigantic zone of resistance along the way. While this can correlate with risk-on moves at times, the concern here is that the move was so fast and aggressive that it may create a swell of margin calls from institutional players, which could prelude selling in other markets as those funds or investors look to raise capital elsewhere to meet the call.
So, while the pandemic backdrop has been largely optimistic for market performance, matters may be shifting under our feet and markets appear to be preparing for such.
In Gold, prices were slammed down to support after the Fed in September. But, notably, price action remained above the 1680 inflection point that’s already come into play thrice this year. Support from last week played-in at a Fibonacci level of 1725, crafting a higher-low, and this has helped for a falling wedge formation to build.
Falling wedges are often approached with the aim of bullish breakout potential, looking for the same lacking bearish behavior whilst at lows to, eventually, play-out for a breach of trendline resistance. That breach has already began today with prices tilting up to a fresh weekly high.
To learn more about the falling wedge, check out DailyFX Education
Gold Four-Hour Price Chart
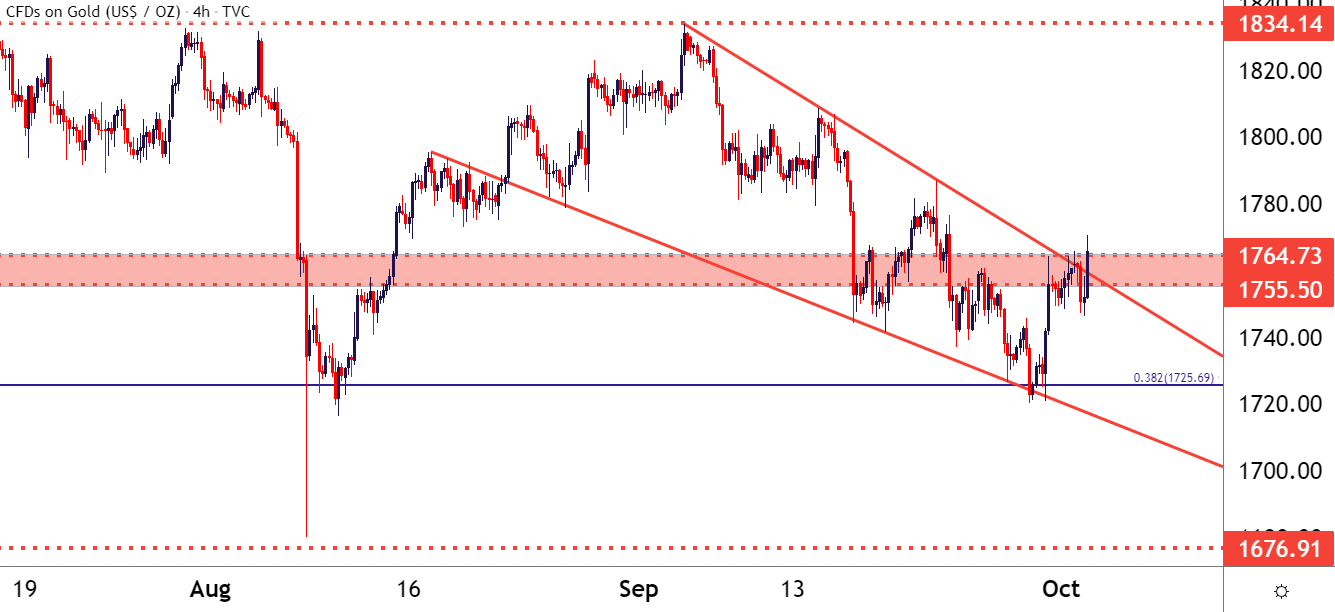
Chart prepared by James Stanley; Gold on Tradingview
Gold Longer-Term: The Bull Flag Remains
It might be difficult to remember but there was a time after the pandemic had started in which Gold traded similar to Bitcoin or Gamestop, running ever higher in an already overbought theme. But in Gold that music stopped last August 7th right after a fresh all-time-high at 2075.
Since then, Gold has been mired by digestion in that bigger-picture theme. The support level that came into play last week to help hold the lows is the 38.2% Fibonacci retracement of that market cycle, taken the 2018 low up to the 2020 high.
The pullback from that high initially remained in a very orderly state, allowing for the build of a bearish channel that when combined with the motive move, makes for a bull flag formation.
The bull flag is often followed with the aim of trend resumption. And while there’s been a few fits and starts already this year, bulls have yet to re-take control of the situation in any meaningful way yet, and this helps to keep the focus on bullish potential especially when matched with the short-term observation looked at above.
To learn more about bull flag formations, check out DailyFX Education
Gold Weekly Price Chart
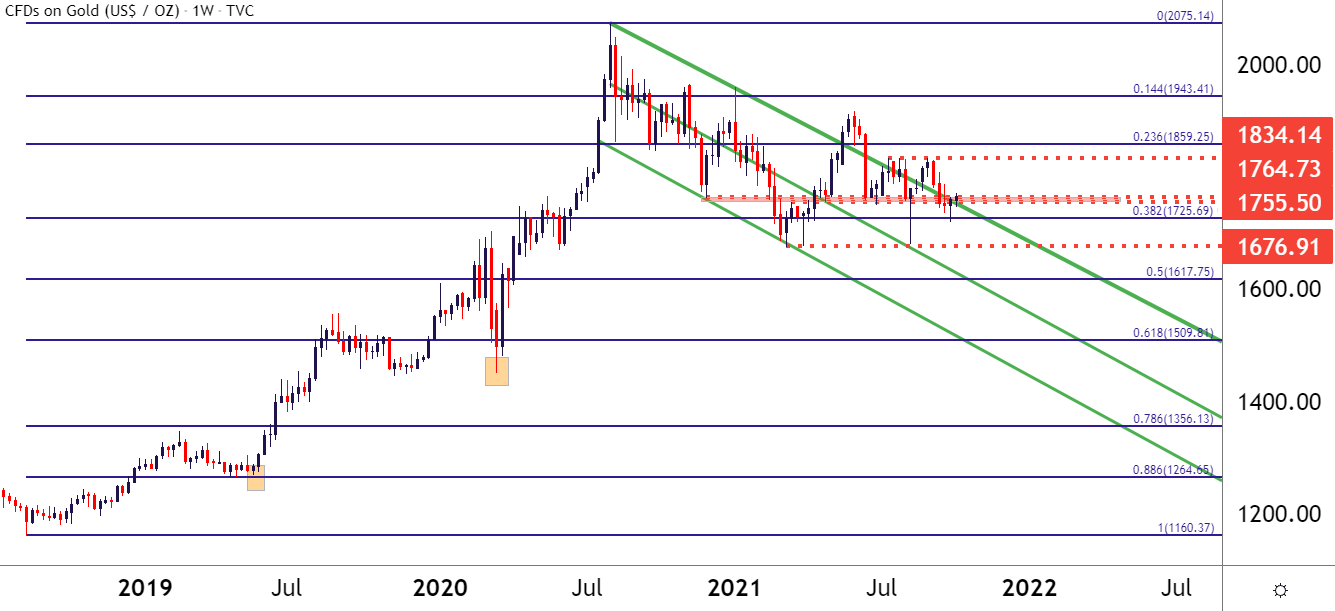
Chart prepared by James Stanley; Gold on Tradingview
--- Written by James Stanley, Senior Strategist for DailyFX.com
Contact and follow James on Twitter: @JStanleyFX


