


Gold Price talking points:
- Gold prices have continued to sell-off in the wake of last week’s FOMC rate decision.
- Gold price action has built a falling wedge formation with support around a longer-term Fibonacci level. And the bigger picture bull flag remains despite the bearish short and intermediate-term price action that’s shown.
- The analysis contained in article relies on price action and chart formations. To learn more about price action or chart patterns, check out our DailyFX Education section.

Gold prices are on the verge of closing out a bearish month in September as the yellow metal stumbled following last week’s FOMC. Gold prices pulled back last Wednesday, guided lower by the Fed’s dot plot matrix that showed a faster potential lift-off for rates, possibly starting as early as next year. Gold hasn’t had much of a bid behind it since then, with Wednesday and Thursday pushing prices below support, and a mild bounce on Friday found resistance at that prior support with price action continuing to fall at this week’s open.
At this point, there’s a Fibonacci level nearby, as the 38.2% retracement of the 2018-2020 major move rests at 1725.69. There’s another major support level below that at 1680, which is currently marking the 2021 low. This price was in play in March, helping to set up a double bottom formation and then it came back into play in early-August during the ‘flash crash’ scenario in Gold. Collectively these prices provide some support structure even despite that bearish price action that’s been showing since last week’s FOMC.
Gold Four-Hour Price Chart
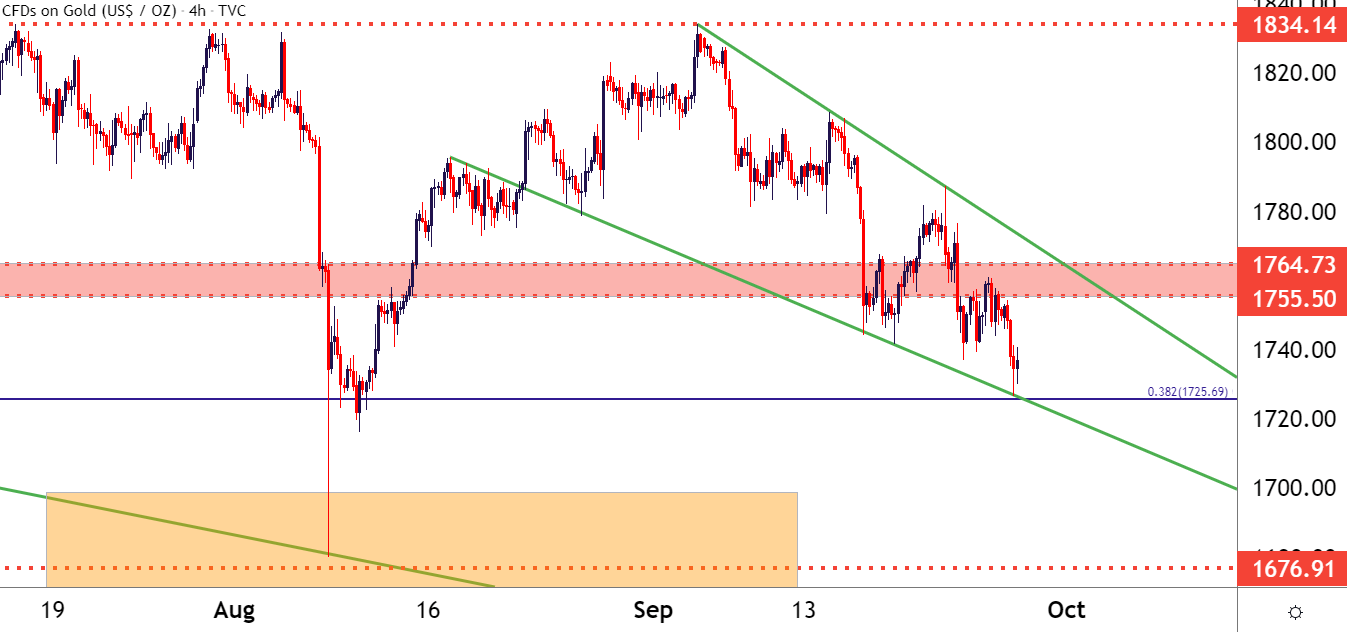
Chart prepared by James Stanley; Gold on Tradingview
Gold Price Strategy Near-Term
At this point, the intermediate and short-term trends are both undeniably bearish. Longer-term, however, the bull flag still remains in order and that can keep the door possibly open for bigger picture approaches, but what happens in that 1680 region is going to be key as to whether this pullback is a buying opportunity for longer-term scenarios.
Probably the most compelling part of the current scenario is what hasn’t yet happened: Despite markets running with risk-off themes as rates continue to rise, the sell-off in Gold has been rather orderly, a stark contrast to the ‘flash crash’ scenario that showed in early-August. Deductively, this may be telling us something.
To learn more about the bull flag, check out DailyFX Education
Gold Weekly Price Chart: Bull Flag Remains
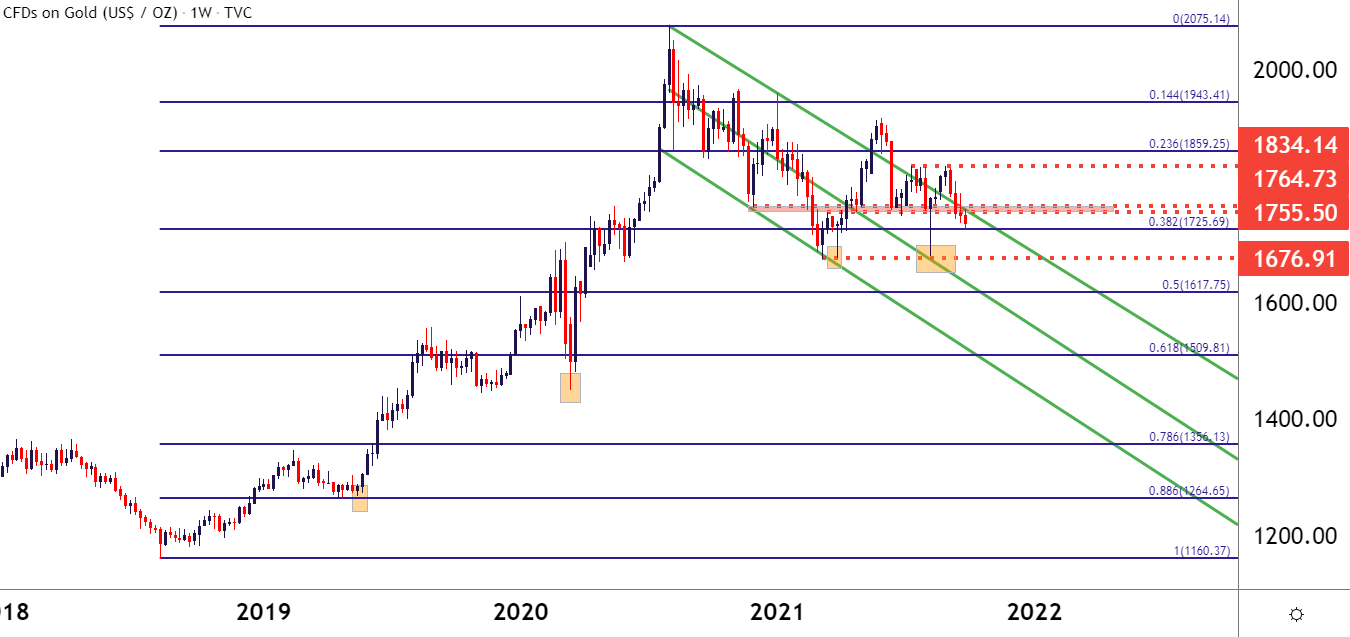
Chart prepared by James Stanley; Gold on Tradingview
Gold: Near-Term Prospects
On a shorter-term basis, that somewhat orderly recent sell-off in Gold has taken the form of a falling wedge formation with a base building around that Fibonacci level. Falling wedges are often approached with the aim of bullish reversals, looking for the lack of aggression at the lows to, eventually, play through for a reversal theme. This can keep the door open to short-term bullish approaches that may sync what that longer-term bullish look investigated above.
On the short side of Gold, breakout potential exists below Fibonacci support with a possible open door down towards 1680 support. There’s another possible support between those two prices, around the 1700 psychological level.
To learn more about falling wedges, psychological levels or Fibonacci, check out DailyFX Education
Gold Eight-Hour Price Chart
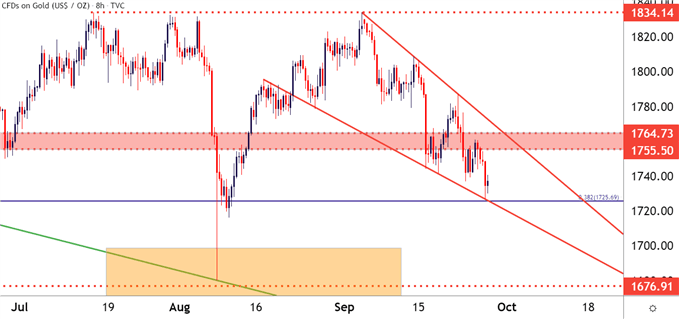
Chart prepared by James Stanley; Gold on Tradingview
--- Written by James Stanley, Senior Strategist for DailyFX.com
Contact and follow James on Twitter: @JStanleyFX


