


Gold Talking Points:
- Gold prices are pushing higher so far this week and the FOMC is waiting in the wings with their September rate decision.
- Gold prices are coiled and breakout potential exists ahead of the rate decision. The longer-term chart is perhaps even more intriguing as a bull flag formation remains in-place.
- The analysis contained in article relies on price action and chart formations. To learn more about price action or chart patterns, check out our DailyFX Education section.

Gold prices have stabilized after last week’s spill, but the big question remains whether bulls will be able to re-take control of the matter after a series of breakouts failed to fill in over the past couple of months.
In July and early-August, the big level was at 1834, and Gold prices put in four different tests of this price, none of which saw bulls drive through. Three of those four failed tests took place in July and early-August, after which prices spilled for a nasty retracement down to the 2021 low at 1680. That level held and buyers got back on the bid, setting up another test at 1834 in early-September but, similarly, that test failed and buyers saw the rug pulled from underneath as prices then retraced down to the 1744 level, which helped to set support last week.
Since then, however, bulls have been back on the bid and prices are pushing back up towards the 1800 handle on the chart, currently catching a bit of resistance from prior swing support, taken from around 1781 on the chart.
Gold Eight-Hour Price Chart
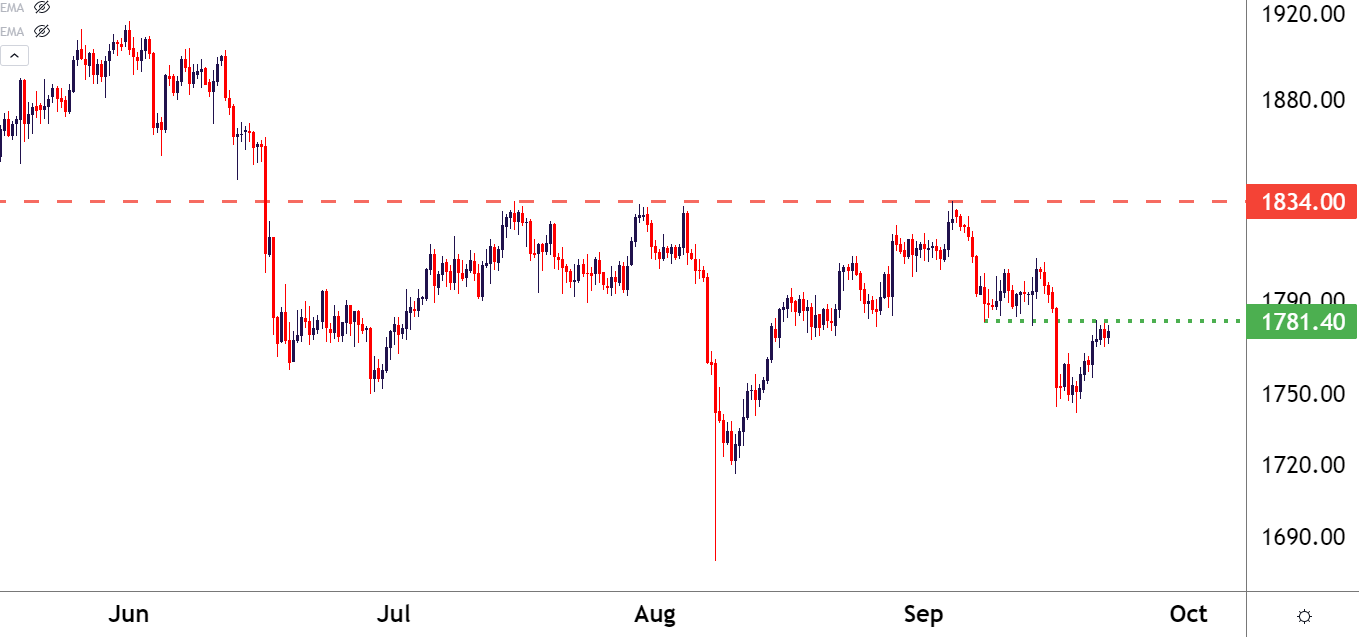
Chart prepared by James Stanley; Gold on Tradingview
Gold: Vulnerable to the Fed for that Next Trend
If one thing has been evident throughout the summer, it’s been Gold’s sensitivity to events around the US Federal Reserve. The last we heard from Chair Powell was at the Jackson Hole Economic Symposium in August, and at that speech he shared that the US economy hadn’t quite met the marker for ‘significant further progress’ on the employment front just yet. After those comments, Gold prices broke out and, eventually, pushed up for another test of resistance at the 1834 handle in early-September.
Adding some additional context to the near-term chart, Gold prices have another couple of resistance zones relatively nearby, the most obvious of which is the 1804-1808 area. This support-turned-resistance has been in-play since early-August and this is the current two-week-high in Gold prices.
To learn more about the FOMC, check out DailyFX Education
Gold Two-Hour Price Chart
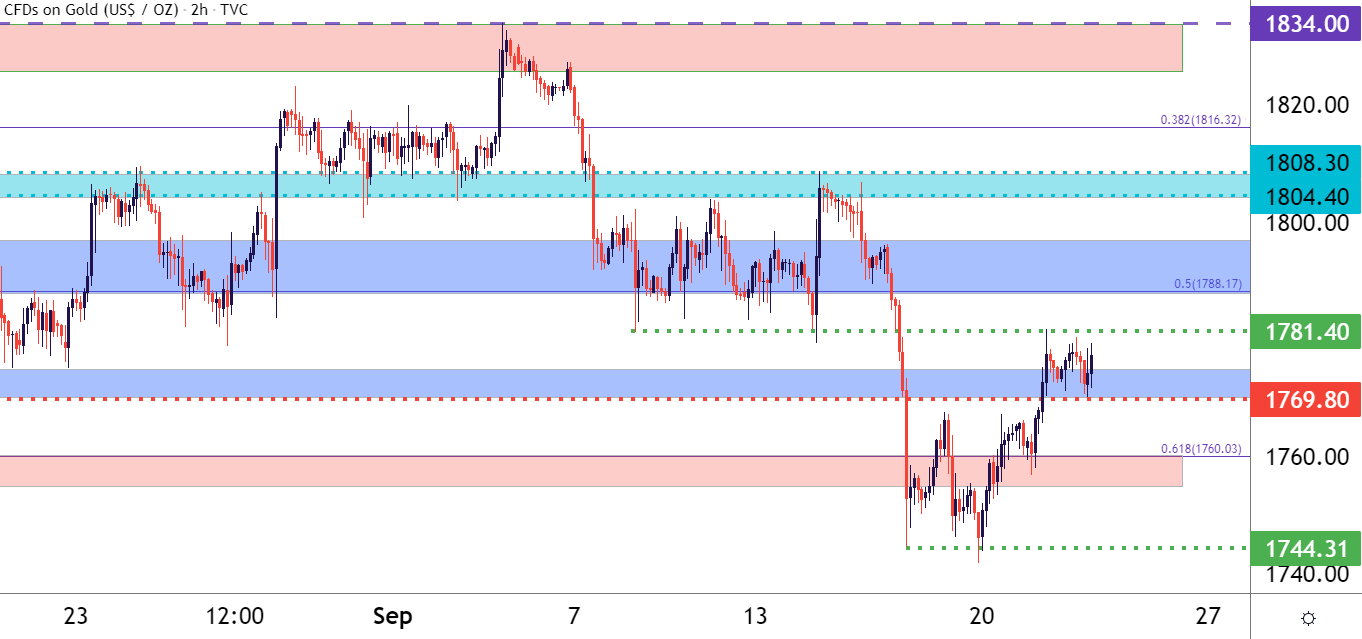
Chart prepared by James Stanley; Gold on Tradingview
Gold Prices Bigger Picture: The Bull Flag Remains
Taking a step back to the longer-term chart and there is still a bullish lean here as the bull flag formation does remain in order, flash crashes and all. From the weekly chart below, we can see where that early-August spill essentially amounted to a test of the mid-line from the bearish channel making up the bull flag.
There’s also some notable levels that can be taken from this longer-term look on Gold, namely the support zone spanning 1755-1764. This functioned as the ‘neckline’ from a double bottom formation in the month of March and, since then, its put in multiple tests of support, most recently this week. But, this also highlights the importance of that 1834 level as a break above indicates resumption in the bigger-picture bullish trend. If/when that 1834 break shows up, it could open the door to bigger-picture bullish prognostications on Gold.
To learn more about bull flag formations, check out DailyFX Education
Gold Weekly Price Chart
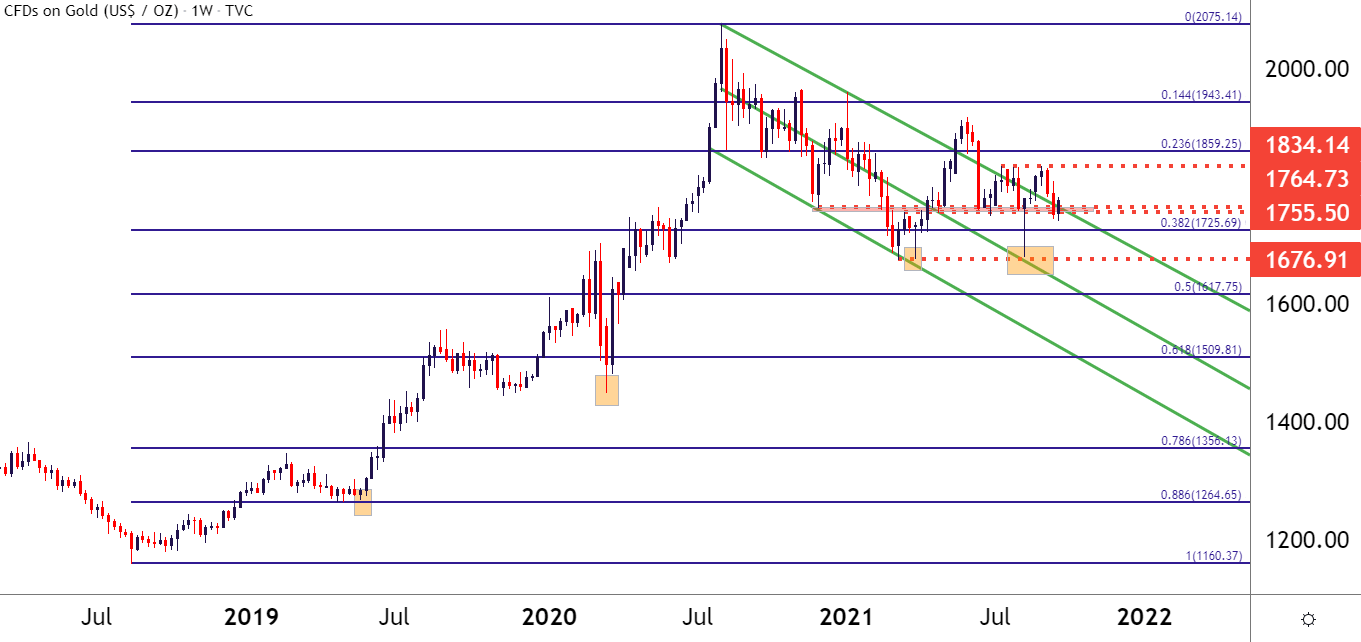
Chart prepared by James Stanley; Gold on Tradingview
--- Written by James Stanley, Senior Strategist for DailyFX.com
Contact and follow James on Twitter: @JStanleyFX


