


US Dollar Talking Points:
- The US Dollar pulled back this morning after the release of July CPI data.
- Headline CPI printed above expectations (5.4% v/s 5.3% expected) as core CPI printed in-line at 4.3%.
- The analysis contained in article relies on price action and chart formations. To learn more about price action or chart patterns, check out our DailyFX Education section.

The US Dollar came into today’s US session already perked-up, holding near the four-month-high at 93.19. That CPI release again came out above expectations, with headline printed at 5.4% versus the expected 5.3%; although Core CPI printed in-line at the 4.3% expected.
To learn more about CPI, check out DailyFX Education
The immediate response in the USD was retreat as the Greenback scaled down to the nearby zone of support plotted around 92.89. This support zone had previously showed as resistance coming into this week and, so far, it’s held today’s low after the CPI-fueled pullback.
US Dollar Hourly Price Chart
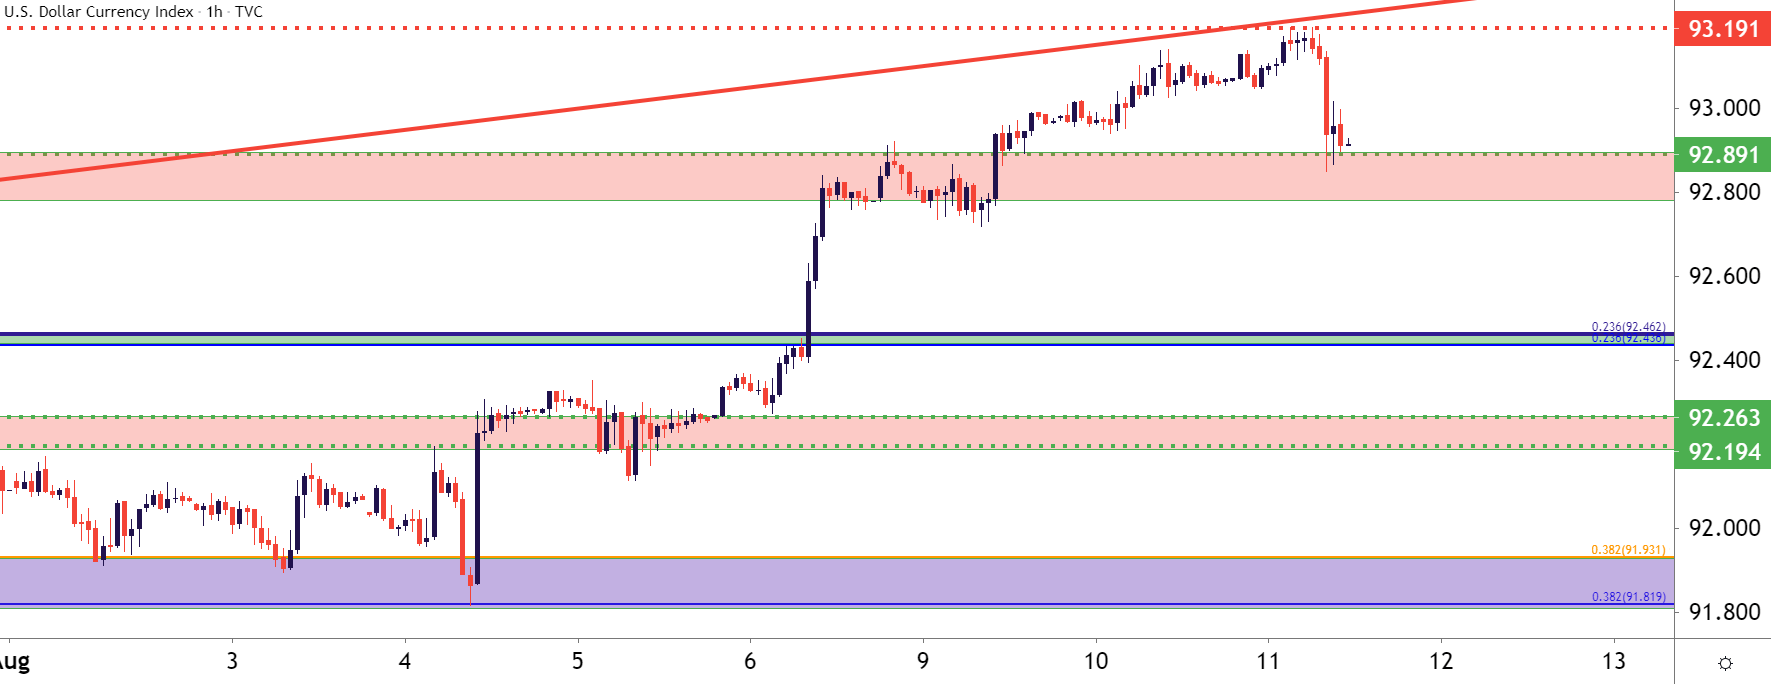
Chart prepared by James Stanley; USD, DXY on Tradingview
EUR/USD Bounces from 2021 Lows
With USD pulling back, EUR/USD has jumped from a re-test of the 2021 low at 1.1704. As looked at yesterday, retail positions were loading up on the long side in EUR/USD as that support zone came into play. With USD dropping on the heels of CPI data, EUR/USD has put in a bounce from this zone.
For USD bulls or those that are looking at getting long around the earlier-mentioned support, the short-side of EUR/USD can be attractive, looking for prices to find that lower-high resistance. As I had mentioned in the webinar yesterday, the psychological level around 1.1750 could be looked to as one of the first areas where that resistance may begin to show.
To learn more about psychological levels, check out DailyFX Education
EUR/USD Daily Price Chart
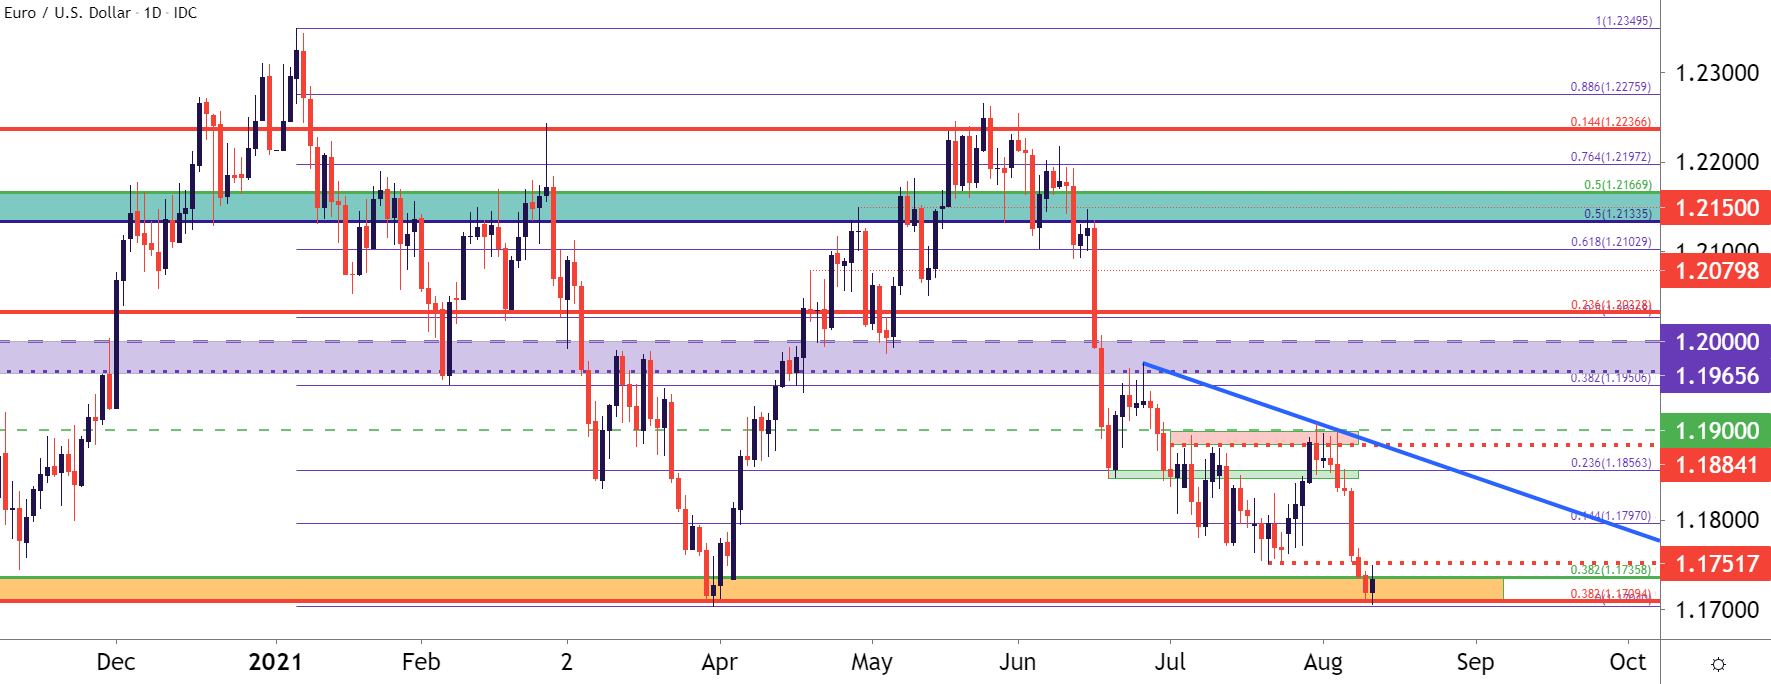
Chart prepared by James Stanley; EURUSD on Tradingview
GBP/USD for Bearish USD Plays
I’ve been following the British Pound for strength plays of late and for USD-bears or for those looking for a deeper move of USD-weakness, GBP/USD remains of interest.
The pair had built into a falling wedge coming into this morning’s data, and such formations are often followed with the aim of bullish reversals. As USD dropped, prices rose out of the top of the formation, giving the appearance of bullish continuation potential.
For those that would like to move forward a bit more conservatively, they can look to the Fibonacci level at 1.3879 for a bit of confirmation, waiting for bulls to test through that level as signal for continuation potential.
To learn more about Fibonacci or the falling wedge formation, check out DailyFX Education
GBP/USD Four-Hour Price Chart
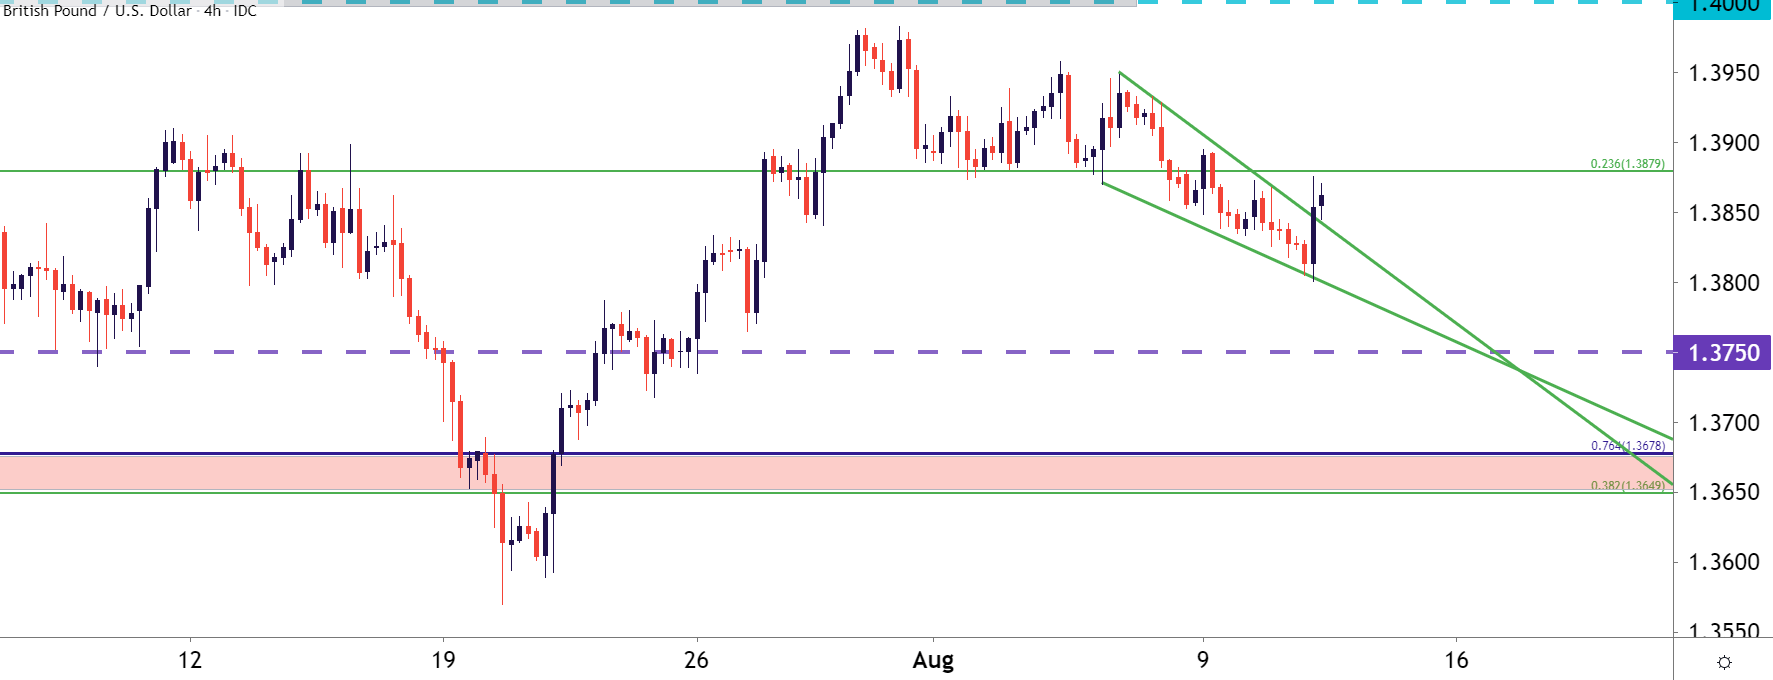
Chart prepared by James Stanley; GBPUSD on Tradingview
USD/JPY: The One to Watch for Rates Themes
As discussed last week and earlier this week, USD/JPY was an interesting vehicle for rates plays and with US rates rising after Clarida’s comment last week, that pushed the pair higher. Prices put in a breakout at a key spot last week and earlier this week, a pullback to support at that prior area of resistance.
But, now that rates are pulling back after this morning’s CPI data, the question remains as to whether we’re seeing a small pullback or the start of a larger reversal.
In USD/JPY at the moment, bullish scenarios remain alive as prices are holding support as taken from prior resistance, plotted at around 110.36. A bit deeper is another key support level and this was the level that caught a quick support inflection earlier this week before prices broke out to another fresh high; and that zone plots around the 110.00 psychological level.

USD/JPY Four-Hour Price Chart
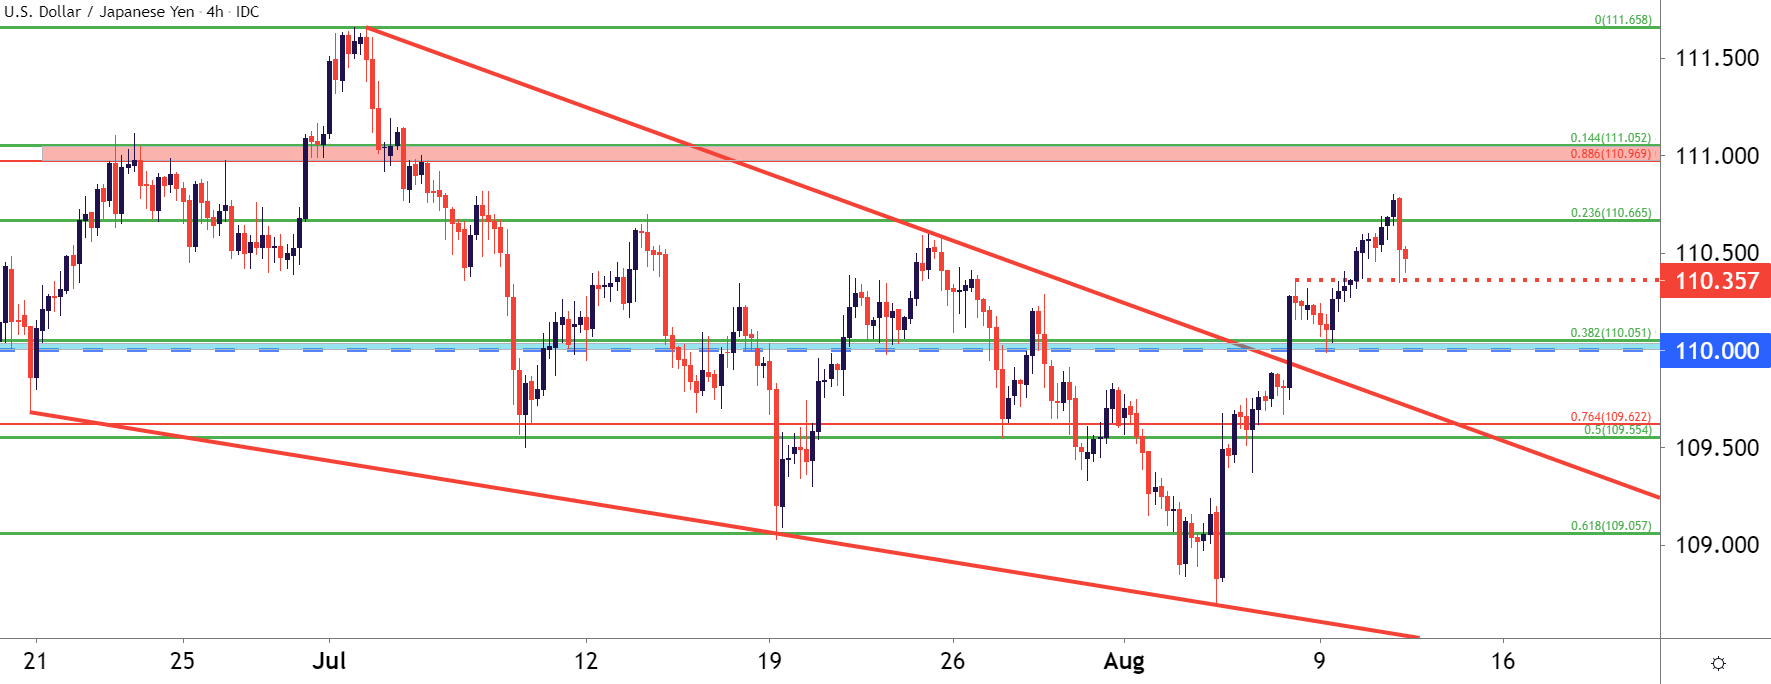
Chart prepared by James Stanley; USDJPY on Tradingview
--- Written by James Stanley, Senior Strategist for DailyFX.com
Contact and follow James on Twitter: @JStanleyFX


