


US Dollar Talking Points:
- The US Dollar put in a strong spike this morning on the back of some comments from FOMC Vice Chair, Richard Clarida.
- Ahead of those comments, bad US employment data had the USD moving lower, testing a zone of support that caught last week’s low.
- The analysis contained in article relies on price action and chart formations. To learn more about price action or chart patterns, check out our DailyFX Education section.

The US Dollar caught a strong bid this morning just after testing support. The manner which it printed was really interesting, as a disappointing jobs print at 8:15 AM nudged the Greenback lower, but a comment from FOMC Vice Chair Richard Clarida an hour later brought a very different impact.
The US Dollar spiked after Clarida mentioned that taper could happen this year, and it wouldn’t necessarily be connected to rate hikes. This caught many by surprise as it was just last week that Chair Powell talked up the prospect of keeping policy loose in the near term, particularly as struggles continued to show around employment data. This has put a large emphasis on this Friday’s NFP report: This will be the last NFP release ahead of the Jackson Hole Economic Symposium set to go down later this month.
On the below chart, we can see the net impact of this morning’s drivers, with the first horizontal line at 8:15 marking the ADP release that saw a disappointing print of 330k v/s the 695k expectation. And then at 9:35, we can see the USD bottoming before beginning to climb with prices jumping straight into resistance, which has helped to guide the move in the three hours since.
US Dollar Five-Minute Price Chart
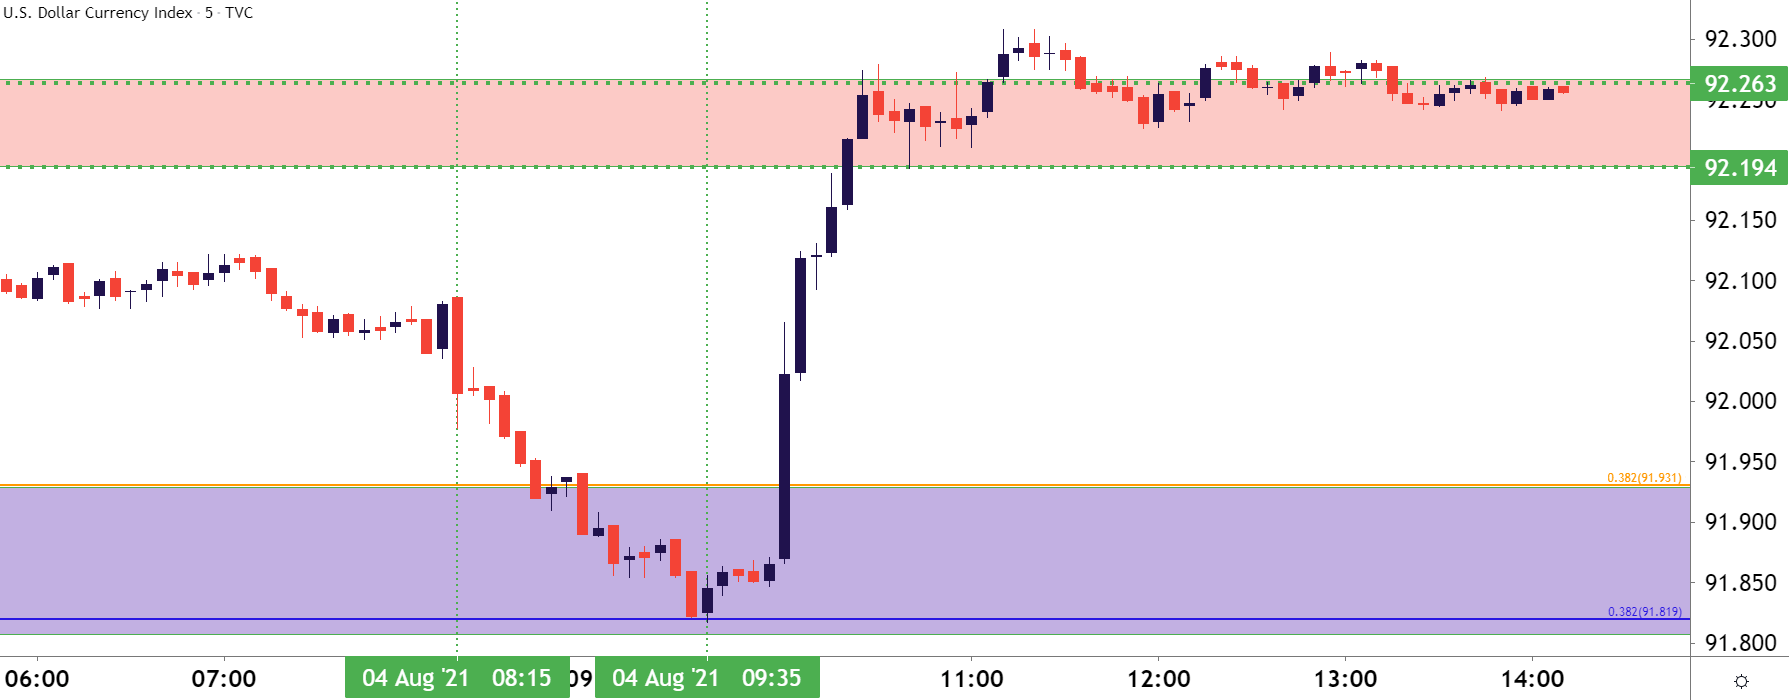
Chart prepared by James Stanley; USD, DXY on Tradingview
Taking a step back for some context, and we can see where the resistance appears to be giving way as the zone faces further tests. This opens the door for a move up to the next resistance area, plotted around 92.46 where a couple of different Fibonacci levels rest in tight proximity.
To learn more about Fibonacci, check out DailyFX Education
US Dollar Four-Hour Price Chart
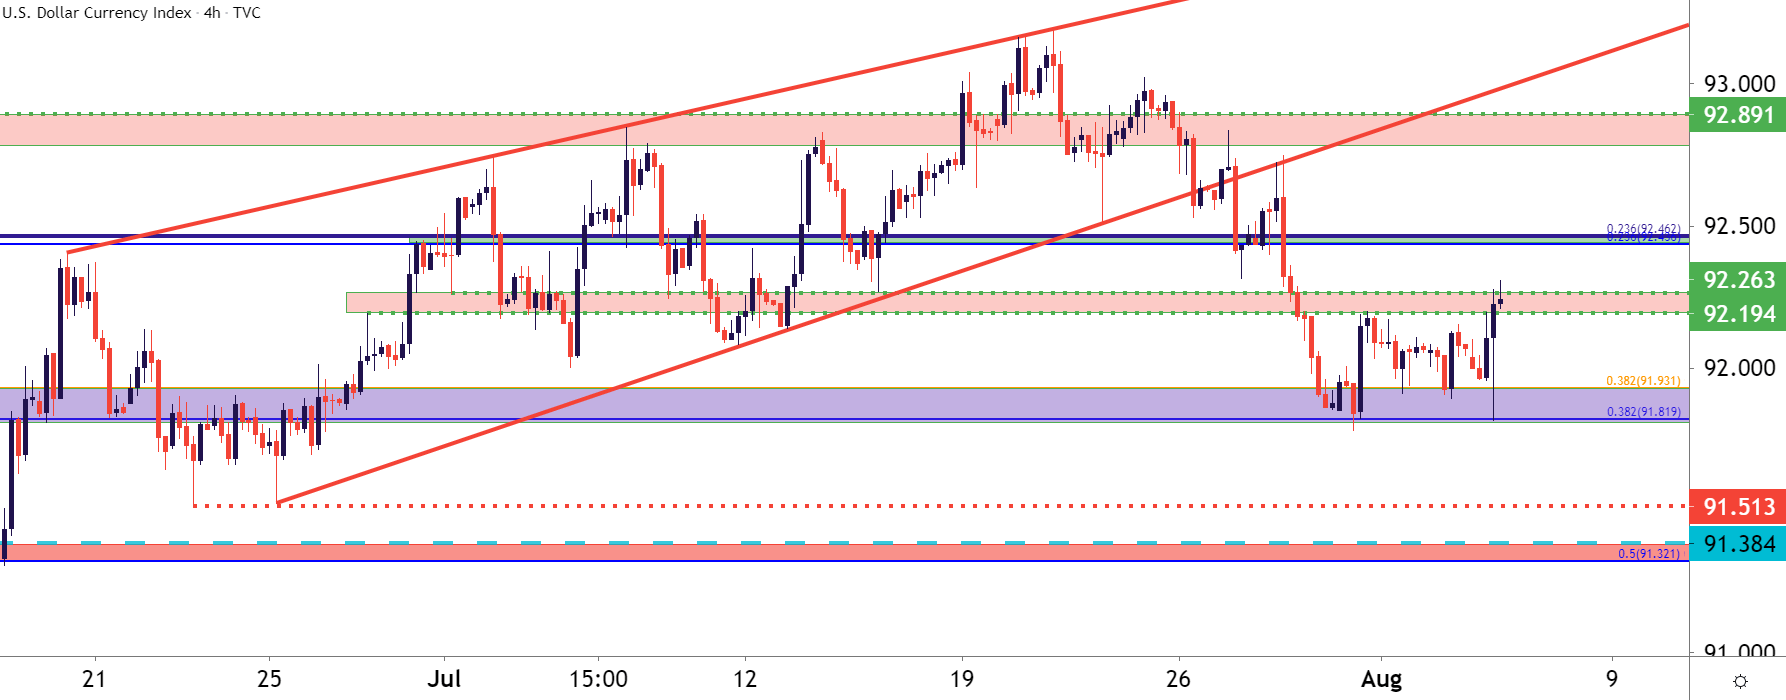
Chart prepared by James Stanley; USD, DXY on Tradingview
EUR/USD Rejection at Resistance
I had looked into EUR/USD earlier today as the pair was nearing a test of the 1.1900 handle. As I’d shared, given the failed tests in this area so far, traders would likely want to look for some element of confirmation or by giving the setup a bit of room to work for fear of another false breakout.
But as the USD reversed, so did EUR/USD, with prices pulling from the 1.1900 level that had come into play earlier this morning and, already, price action is testing below the 1.1850 area of the chart that’d previously functioned as support.
At this point, from the Daily chart, bearish swing potential is starting to look more attractive, with aim towards the 1.1800 level after which the 2021 low comes into play just above the 1.1700 handle.
EUR/USD Daily Price Chart
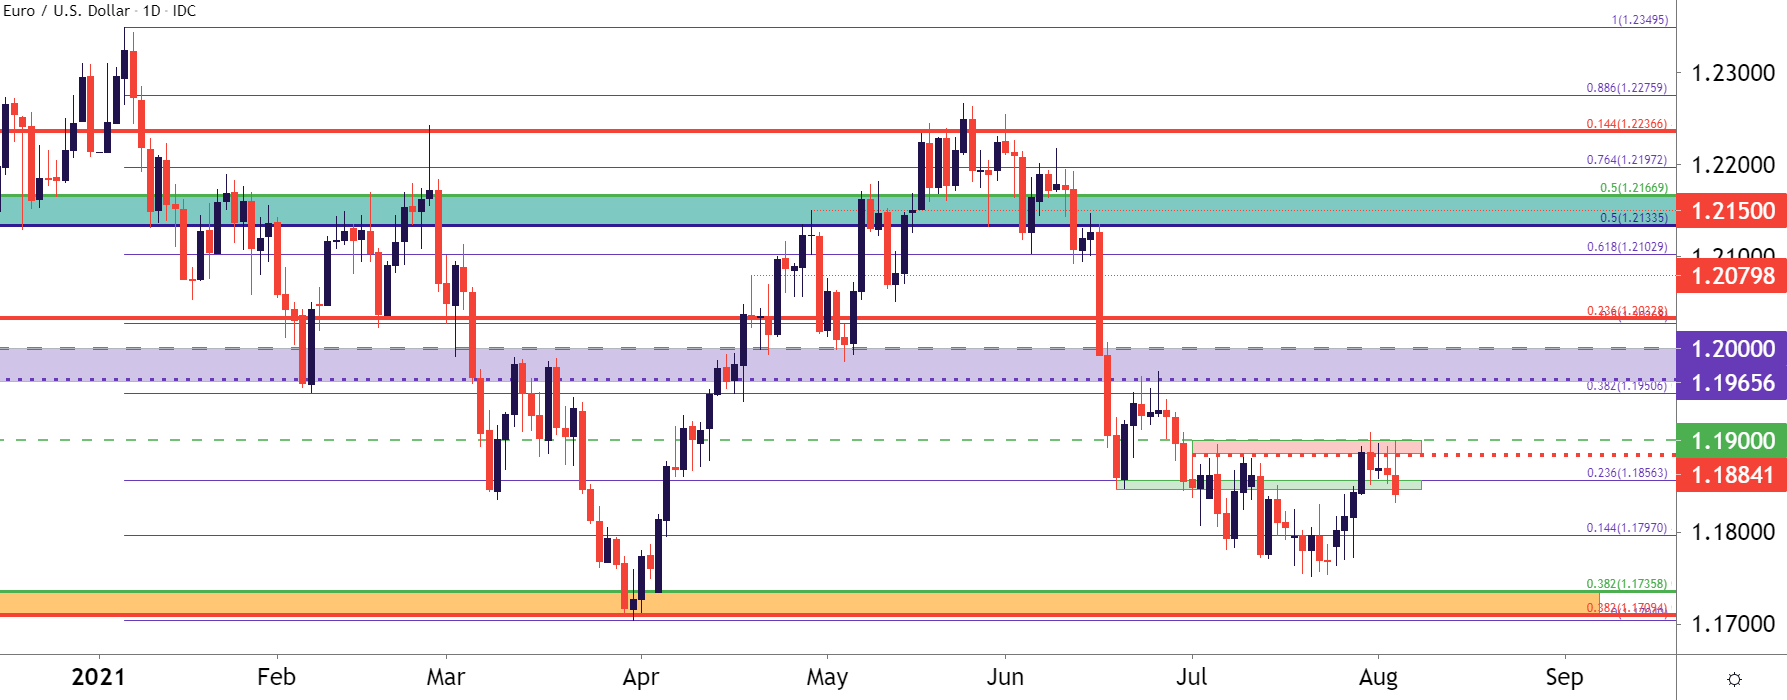
Chart prepared by James Stanley; EURUSD on Tradingview
GBP/USD: Back to Support
For those looking to fade this run of USD-strength, GBP/USD is of interest. I had looked into a key area of support in the pair yesterday, taken from the 1.3879 Fibonacci level. That led to a bounce ahead of this morning’s reversal, with price making a retreat back towards that same support zone.
This keeps the door open for bullish scenarios in the pair, particularly for those looking for USD-weakness.
GBP/USD Hourly Price Chart
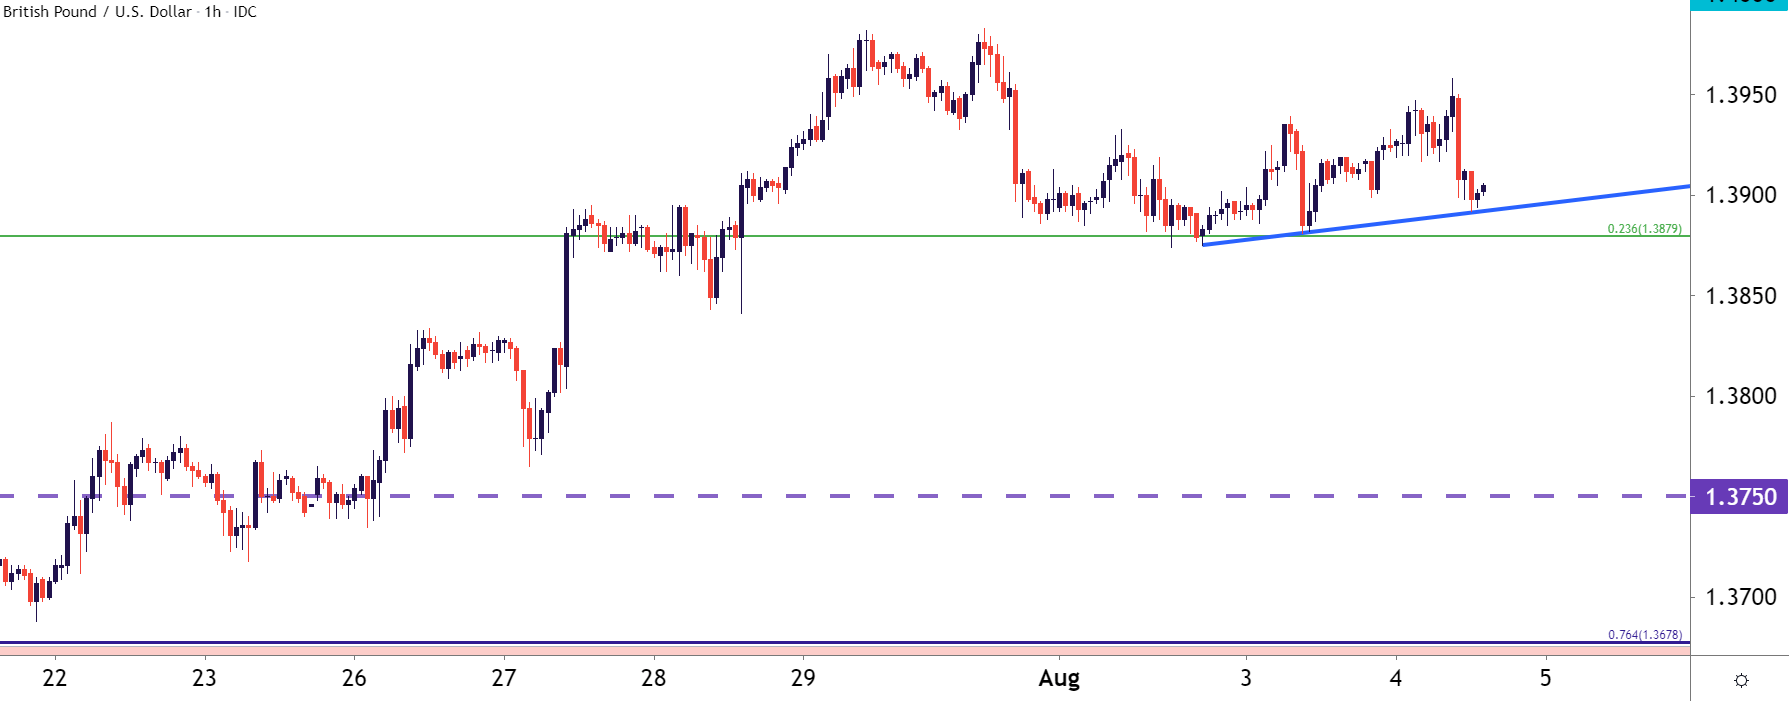
Chart prepared by James Stanley; GBPUSD on Tradingview
USD/CAD Holding Higher-Low Support in Key Zone
If looking for USD-strength, USD/CAD remains a compelling option. I had looked into this one on Monday, highlighting the move back into a key zone starting around 1.2500. And last week I had highlighted a key spot of support at the 1.2426 area on the chart. That held and prices pushed into the 1.2500 psychological level ahead of this morning’s USD move.
At this point, the bullish construction in the pair keeps the door open for topside continuation, and this can remain of interest to USD-bulls looking for a more prolonged move of US Dollar strength ahead of Friday’s NFP report.
To learn more about psychological levels, check out DailyFX Education
USD/CAD Daily Price Chart
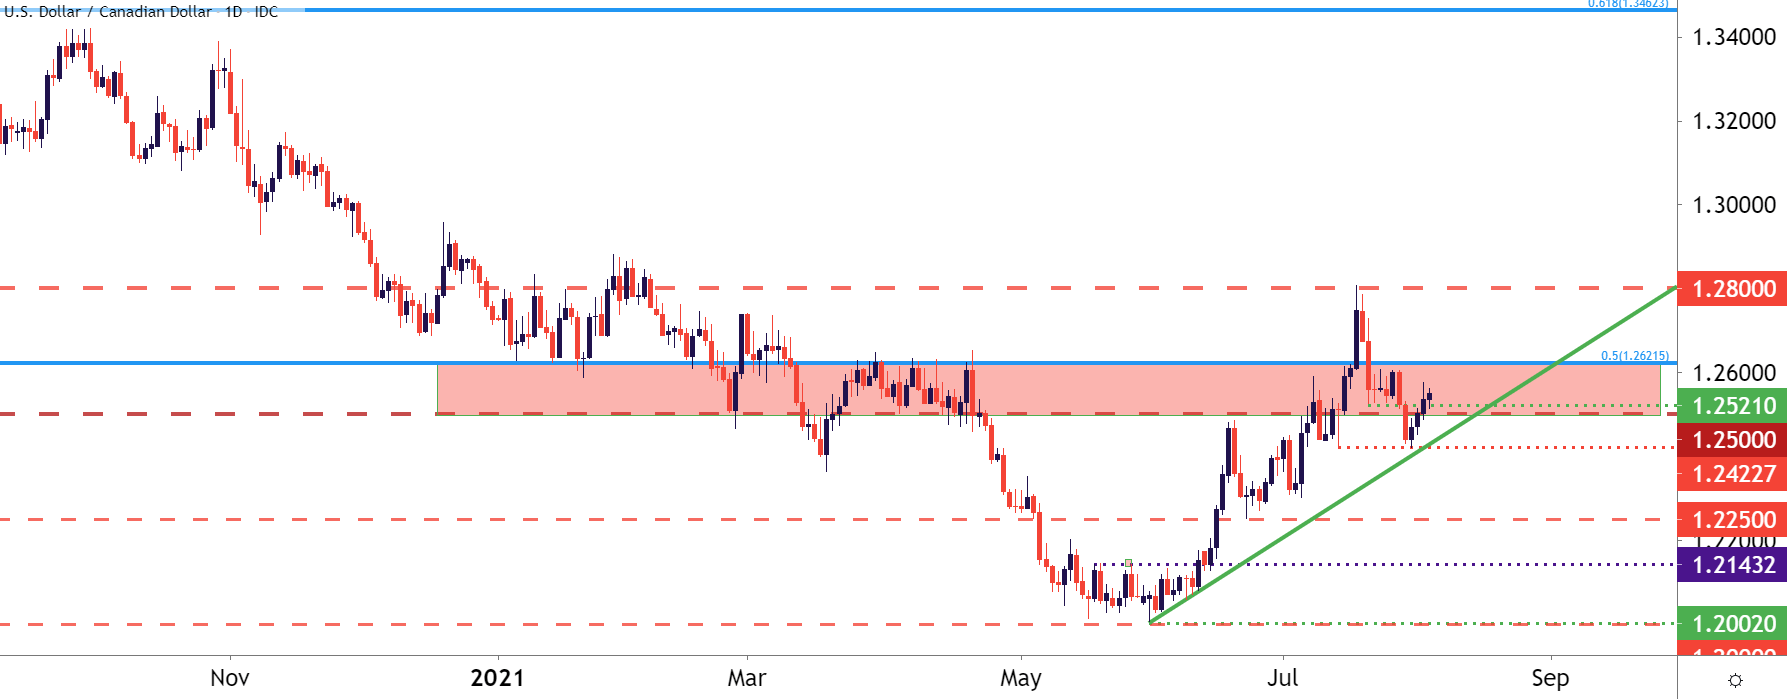
Chart prepared by James Stanley; USDCAD on Tradingview
--- Written by James Stanley, Senior Strategist for DailyFX.com
Contact and follow James on Twitter: @JStanleyFX


