


US Dollar Talking Points:
- The US Dollar finds itself between fairly well-defined support and resistance.
- The big driver for this week is Friday’s NFP release, and there’s perhaps even more emphasis on employment data following last week’s FOMC rate decision.
- The analysis contained in article relies on price action and chart formations. To learn more about price action or chart patterns, check out our DailyFX Education section.

The US Dollar is coming into the week with some relative balance given the nearby support and resistance that are currently holding price. This is a different picture from last week, however, as the FOMC rate decision on Wednesday sent the USD spiraling-lower until support played-out from a confluent area of Fibonacci retracements. That support inflection marked a fresh monthly low, and led to a bounce on Friday that caught resistance at a familiar area, taken from prior support around 92.20-92.26 in DXY.
To learn more about Fibonacci, check out DailyFX Education
US Dollar Four-Hour Price Chart

Chart prepared by James Stanley; USD, DXY on Tradingview
Taking a step back on the chart, and last week’s bearish move broke through the bottom of a rising wedge formation. Such patters are often followed with the aim of bearish reversals, and this could produce a deeper downside run should the reversal continue. But the big sticking point as to whether or not that takes place is this week’s data with key emphasis on that NFP report.
To learn more about the rising wedge, check out DailyFX Education
Employment is somewhat of the hot button at the Federal Reserve right now and with inflation printing above 5% last month, lagging employment is one of the items that’s allowed the Fed to stay pedal-to-the-floor on the accommodation front. If that changes, so could price behaviors; and likely, there will be considerable focus on this Friday’s jobs report as it’s the last such report before the Jackson Hole Economic Symposium later this month.
US Dollar Daily Price Chart

Chart prepared by James Stanley; USD, DXY on Tradingview
EUR/USD Sticking Between Support and Resistance
Very similar to the short-term backdrop in USD above, EUR/USD is holding between short-term support and resistance levels.
The pair came very close to testing the 2021 low in late-July, but caught a bid last week after the FOMC. The takeaway here, in my opinion, is how that lift seems abbreviated when compared to what showed in GBP/USD, which we’ll look at below.
After finding resistance in the 1.1885-1.1900 zone, a quick check back to support around 1.1850 showed, with prices soon returning to resistance. This can keep the door open for short-term breakouts in the pair should that high get taken out. But, given the additional run that showed in GBP/USD on the heels of last week’s FOMC, the question must be asked whether EUR/USD is the most optimal vehicle for USD-weakness scenarios.
EUR/USD Four-Hour Price Chart
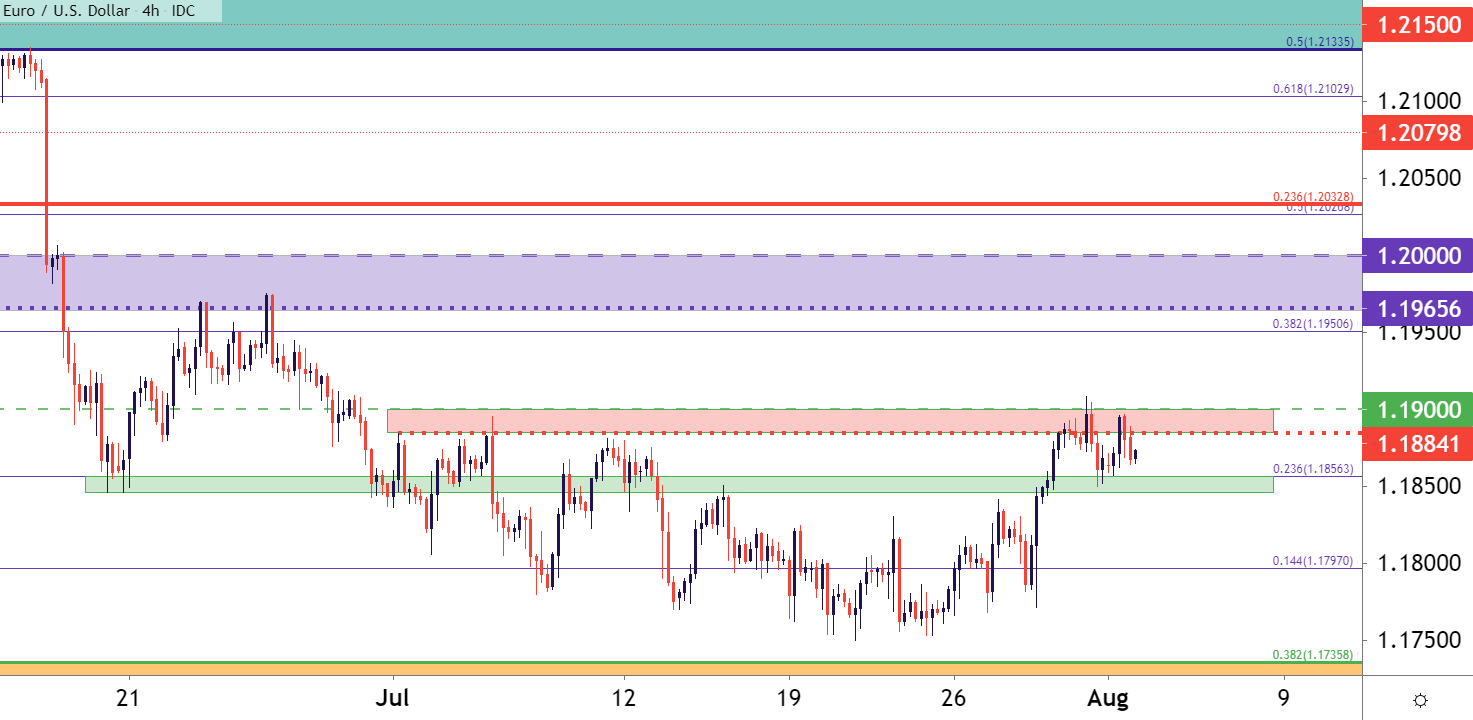
Chart prepared by James Stanley; EURUSD on Tradingview
GBP/USD: Cable Breakout Take-Out
I had looked at GBP/USD just ahead of the FOMC last week, remarking on its bullish potential given price’s adherence to a nearby Fibonacci level at 1.3879.
The breakout showed with force as GBP/USD made a run towards the 1.4000 psychological level, falling a bit short before pulling back. And already this week, that 3879 Fibonacci level has come back into play as support after prices pulled back.
This can keep the door open for topside scenarios in the pair.
GBP/USD Four-Hour Price Chart
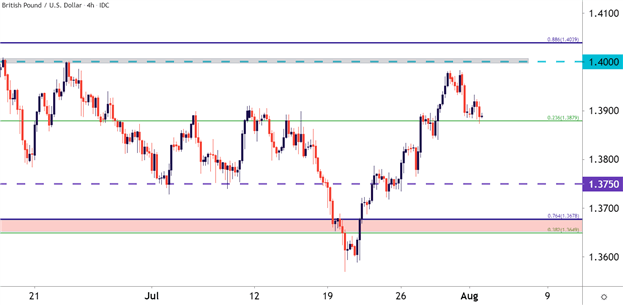
Chart prepared by James Stanley; GBPUSD on Tradingview
USD/CAD Tips Up to 1.2500
USD/CAD ran into a really big level last week at 1.2426, where there was both a price action swing and a trendline projection in tight proximity. That support held and prices have since bounced, with USD/CAD now testing above the 1.2500 psychological level.
This presents an interesting setup, particularly for USD-bears. USD bears can monitor the move to see whether sellers begin to respond in the 1.2500-1.2521 area.
To learn more about psychological levels, check out DailyFX Education
USD/CAD Four-Hour Price Chart
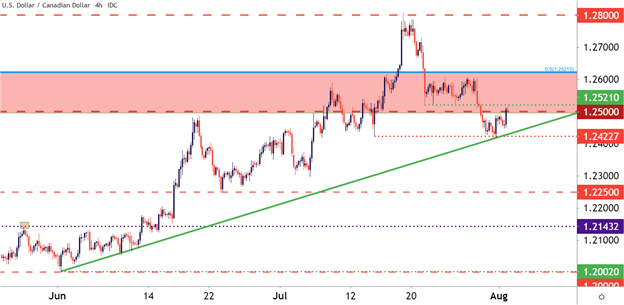
Chart prepared by James Stanley; USDCAD on Tradingview
--- Written by James Stanley, Senior Strategist for DailyFX.com
Contact and follow James on Twitter: @JStanleyFX


