


US Dollar Talking Points:
- The US Dollar is holding support around the 92.50 area on the chart after a week-long pullback.
- Later this afternoon brings the July FOMC rate decision with the wide expectation for little change, looking for Powell to remain cautious as covid variant numbers rise.
- The analysis contained in article relies on price action and chart formations. To learn more about price action or chart patterns, check out our DailyFX Education section.

The US Dollar is putting in a bounce from yesterday’s lows, following a week-long pullback as the FOMC gears up for their July rate decision.
With this being a non-quarterly meeting, there’s scant expectation for anything new. As outlined by our own Rich Dvorak, given the rise in covid variant numbers and the risk of continued expansion there, this seems like a meeting where Chair Powell may continue to bias towards caution when discussing policy parameters.
Perhaps with that expectation being priced-in, the US Dollar has spent much of the past week pulling back from fresh three-month-highs. Those highs printed just above a zone of previously unfilled gap from early-Q2, with the 93.00 psychological level also coming into play on DXY.
The pullback thus far has found support around the 23.6% Fibonacci retracement of the 2020 sell-off, plotted at around 92.46. A hold of higher-low support through this afternoon’s FOMC rate decision keeps the door open for bullish strategies in the USD.
To learn more about Fibonacci, check out DailyFX Education
US Dollar Daily Price Chart
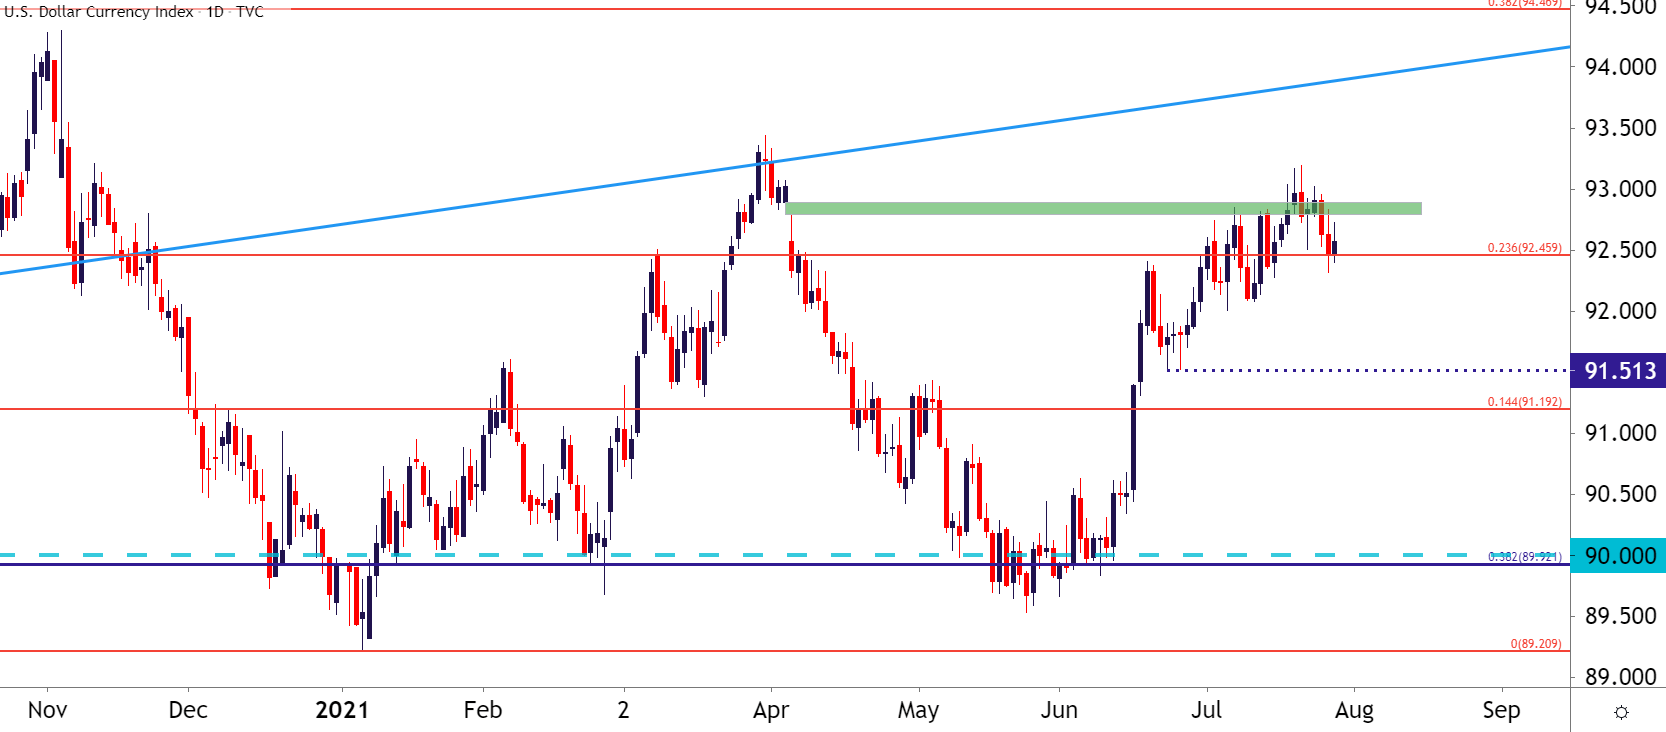
Chart prepared by James Stanley; USD, DXY on Tradingview
EUR/USD
On the long side of the US Dollar, EUR/USD remains compelling. The pair came very close to testing a big spot of support last week, harbored around three-month-lows. After a minor pullback, sellers appear to be showing resistance inside of the 1.1856 Fibonacci level, and this can keep the door open for a re-test of the big spot of support, running from Fibonacci levels around 1.1709-1.1736.
EUR/USD Daily Price Chart
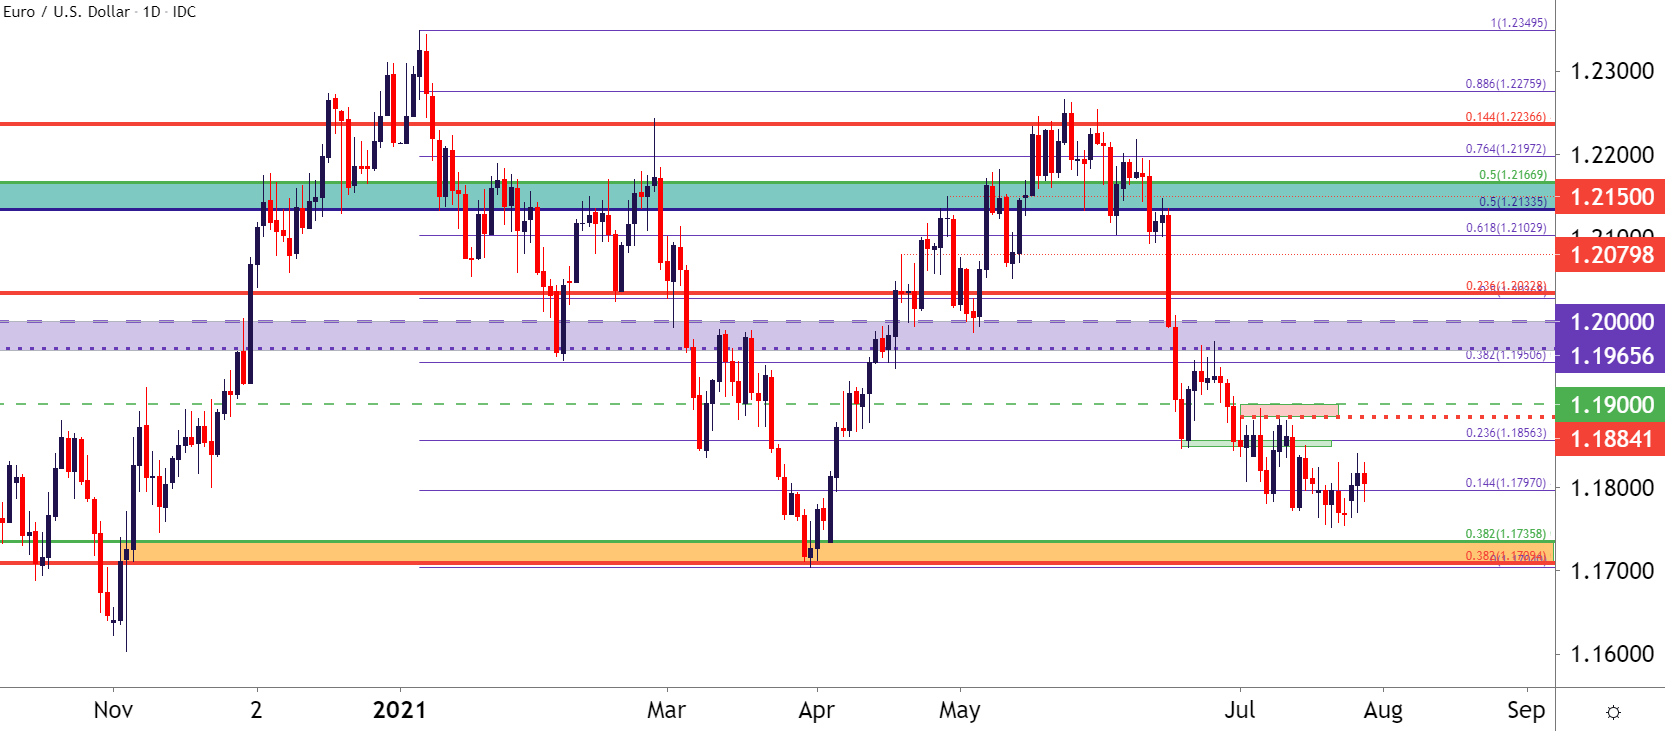
Chart prepared by James Stanley; EURUSD on Tradingview
GBP/USD at a Big Spot
There’s a case on both sides of the USD if looking at GBP/USD. The past week of USD-weakness has reflected very well on the long side of GBP/USD, in stark contrast to the EUR/USD scenario looked at above. This highlights how GBP/USD may be a more amenable venue should USD-weakness result from this afternoon’s FOMC rate decision.
The pair is currently testing a Fibonacci level at 1.3879, similar to what I had looked at earlier in the month. And while that resistance test failed, prices have hurried back with renewed vigor, and this keeps the door open for breakout scenarios.
On the long side of the USD, the look would basically be for a resistance hold with respect to the lower-highs set earlier in the month.

GBP/USD Daily Price Chart
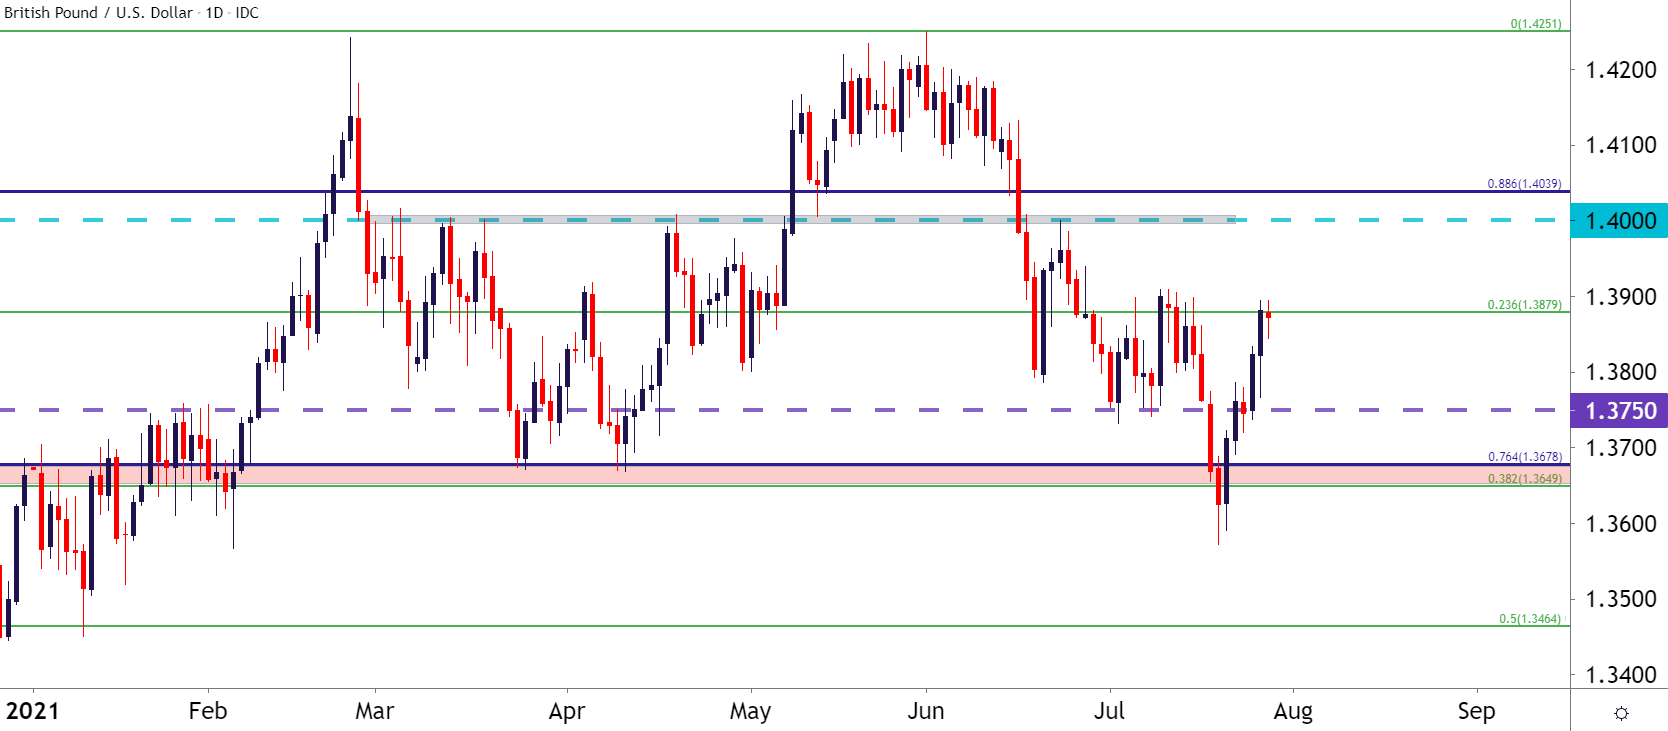
Chart prepared by James Stanley; GBPUSD on Tradingview
USD/CAD Still in the Zone
USD/CAD appears to be lining up attractively for the scenario of USD-strength. Last week saw the pair set a fresh five-month-high while breaking out from a big zone of resistance.
That zone has been in-play for much of 2021 trade, and runs between a Fibonacci level at 1.2622 and the psychological 1.2500 level. Higher-low support has, thus far, held above that 1.2500 spot, and as long as that remains, the door can stay open for longer-term bullish continuation strategies in the pair.
To learn more about psychological levels, check out DailyFX Education
USD/CAD Daily Price Chart
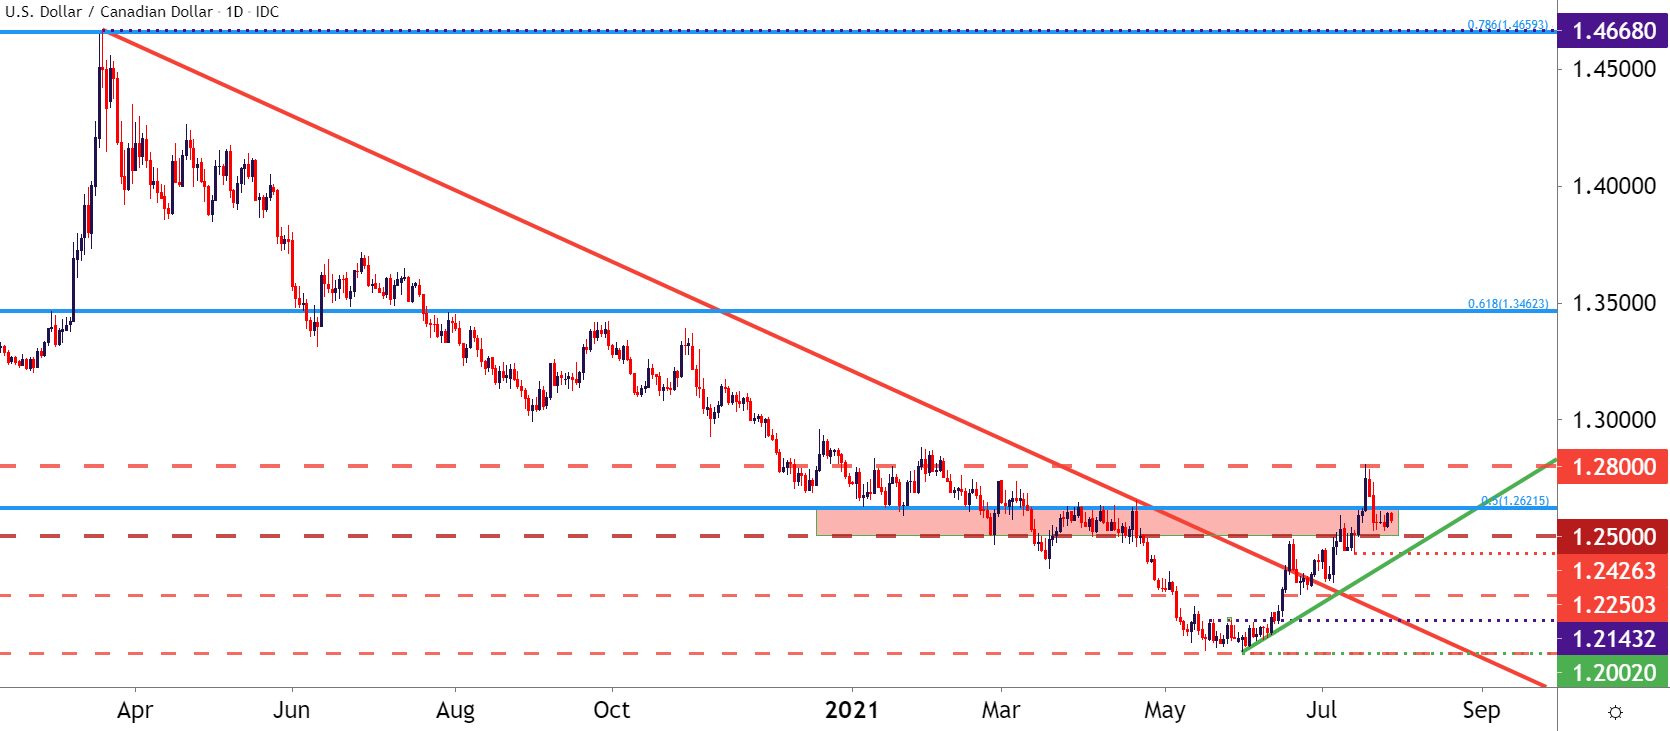
Chart prepared by James Stanley; USDCAD on Tradingview
--- Written by James Stanley, Senior Strategist for DailyFX.com
Contact and follow James on Twitter: @JStanleyFX


