


Gold Price Forecast
- Gold just finished its worst month since November of 2016.
- After November 2016, the Fed hiked eight times over the next two years.
- When the Fed began to shift back into a cutting cycle in 2019, Gold prices began to rally and continued to do so through the pandemic, hitting a fresh all-time-high in August of 2020.
- With Gold prices putting in a heavily bearish move around the June FOMC rate decision, are markets sending another signal that the bullish cycle in Gold is now over?
Gold prices were in a beleaguered state coming into this week, having put in its worst month since November of 2016. That month, of course, was when Donald Trump had won the US presidency and markets ushered in the hopeful ‘reflation’ trade.
Over the course of the next couple years, the FOMC hiked rates eight times. So, Gold traders were acutely aware of the writing on the wall and that drubbing in Gold prices after the election but ahead of the rate hikes proved to be prescient.
Of course the end of that hiking cycle didn’t exactly go down smoothly, and that’s what triggered the recent bullish cycle in Gold. In October of 2018, after the Fed had hiked seven times in the prior two years, Jerome Powell was asked where he thought the neutral rate was. The neutral rate is theoretical rate in which FOMC policy is neither stimulative nor restrictive, so somewhat of a goldilocks number; but in response Chair Powell said that he thought this was ‘a long way off.’
This was widely inferred to mean that the FOMC had plans for even more rate hikes and, sure enough, in December of 2018 when hiking for the eighth time in two years, the Fed forecasted another two hikes in 2019 and in short order risk markets spilled over, fraught with fear that the FOMC was going to hike rates into a recession.
Those 2019 hikes, of course, did not happen. The Fed backed down and ended up cutting rates three times in 2019 instead. But – again, gold markets proved prescient as prices had started to incline from what Jerome Powell said that he thought that the neutral rate was ‘a long way off.’
Gold Monthly Price Chart: Rate Cycles Driving Market Cycles

Chart prepared by James Stanley; Gold on Tradingview

The Bullish Cycle is Now in Question
The current bullish cycle in Gold began in Q4 of 2018, on the heels of those hawkish comments from Chair Powell. After Powell’s remarks, equities began to spill as the US Dollar put in a strong gain during October. The equity sell-off worsened at the rate decision in December, when the Fed hiked again while warning of two more possible hikes in 2019.
This kept the pain trade on going into the Christmas holiday, at which points Fed-speak started to soften, and continued to do so through Q1 of 2019. As this was happening and as markets were calming from the fear of too much tightening, Gold prices began to break-higher, catching a strong gust in June of 2019 when the Fed started to open the door to rate cuts.
The Fed ended up cutting three times in 2019 as opposed to the two hikes that they’d forecasted at the December 2018 rate decision, and this helped to further buoy Gold prices into 2020 trade.
The next year, however, was a complete curveball as Covid took the world by storm. After a knee-jerk reaction in March, buyers got in the driver’s seat, helped along by the troves of stimulus being shoved into the system. This helped Gold prices to rally in an aggressive manner, eventually setting a fresh all-time-high in August of 2020.
But after that high came in, matters began to shift. And what started as a pullback took on more aggression when news of promising vaccines began to hit the headlines. This was November 9th of last year, one week after the election, and Gold prices put in a significant drop to give that pullback more of a reversal tone as hope permeated the horizon.
Gold Daily Price Chart

Chart prepared by James Stanley; Gold on Tradingview

Gold: Where We’re At Today
Until the FOMC rate decision a couple weeks ago, there was a lot to like on the long side of Gold. The nine months of prices pulling back after the all-time-high still fits the description of a bull flag formation.
In the month of March, price action put in a double bottom formation – often approached with the aim of bullish reversals and that’s precisely what started to show in April and May trade with prices eventually breaking out of the bearish channel, giving rise to bullish hypothesis that indicated the possibility of fresh highs.
And that potential even held into the FOMC rate decision, with prices pulling back to a key zone of support ahead of the announcement.
Gold Daily Price Chart
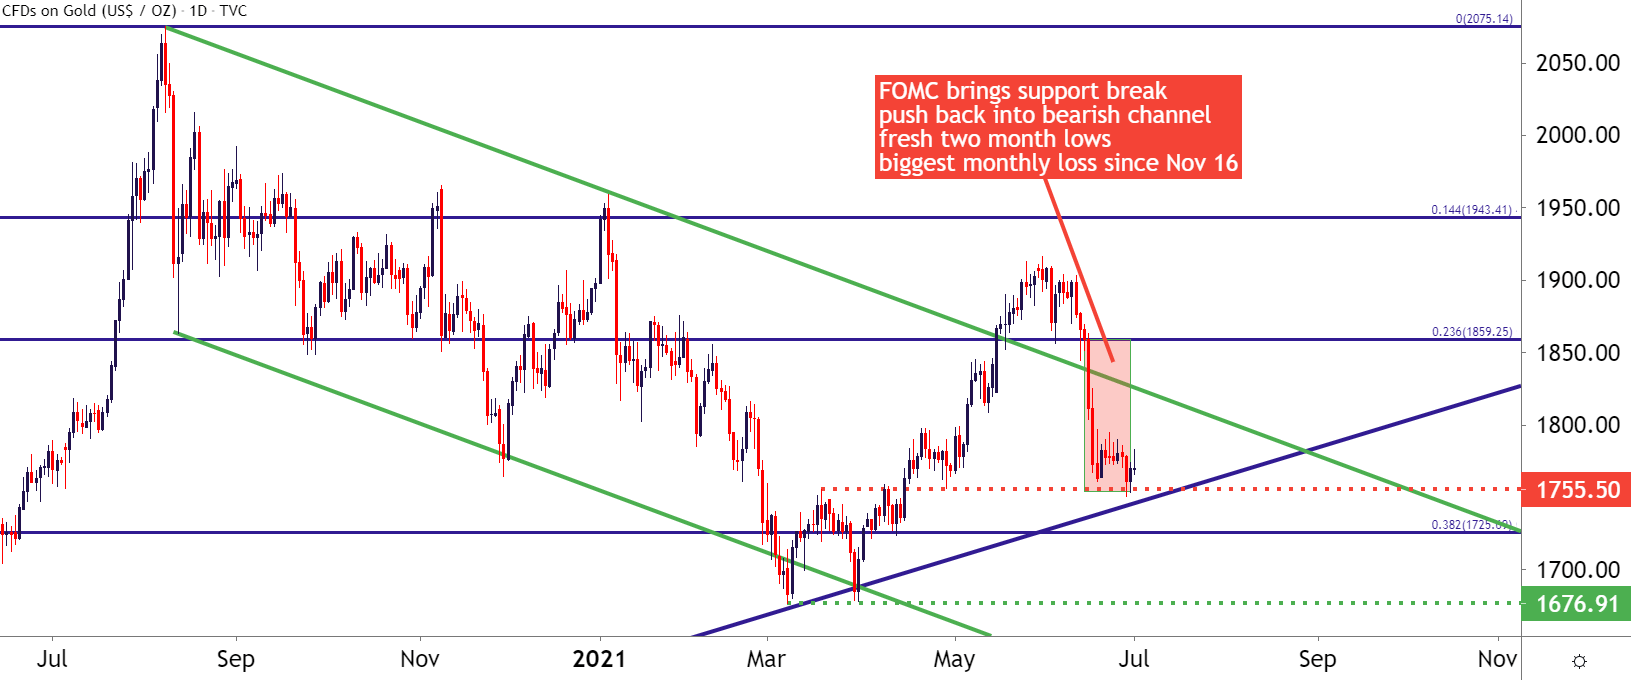
Chart prepared by James Stanley; Gold on Tradingview

Gold Prices: Is the Bullish Trend Dead?
While matters don’t look positive for Gold bulls, there may be some hope yet. At this point prices are holding support at the neckline from the prior double bottom formation – and this can keep the door open for reversal themes on a short-term basis.
Also of interest is a bullish trendline sitting just underneath current price action, along with the 38.2% Fibonacci retracement of the recent major move, plotted around 1725. And below that, there’s one final stop of support for bulls to follow at the double-bottom low, plotting around 1676. If that’s broken through, it’ll be difficult to offer many bullish prognostications on Gold and, likely, we’ll have some element of evidence that tighter policy is on the way from the FOMC.
From where we’re standing now – it looks like Jackson Hole would be the next operative area for the Fed to release details on their plans and, if not there, the September FOMC rate decision is the next set of Quarterly Forecasts from the Fed, and this may prove to be that driver.
And for traders that are looking at the bigger picture, the supports on the below chart may offer pause points for downtrend continuation, at which point traders can then start seeking out lower-high resistance to look for bearish continuation scenarios.
Gold Price Eight Hour Chart
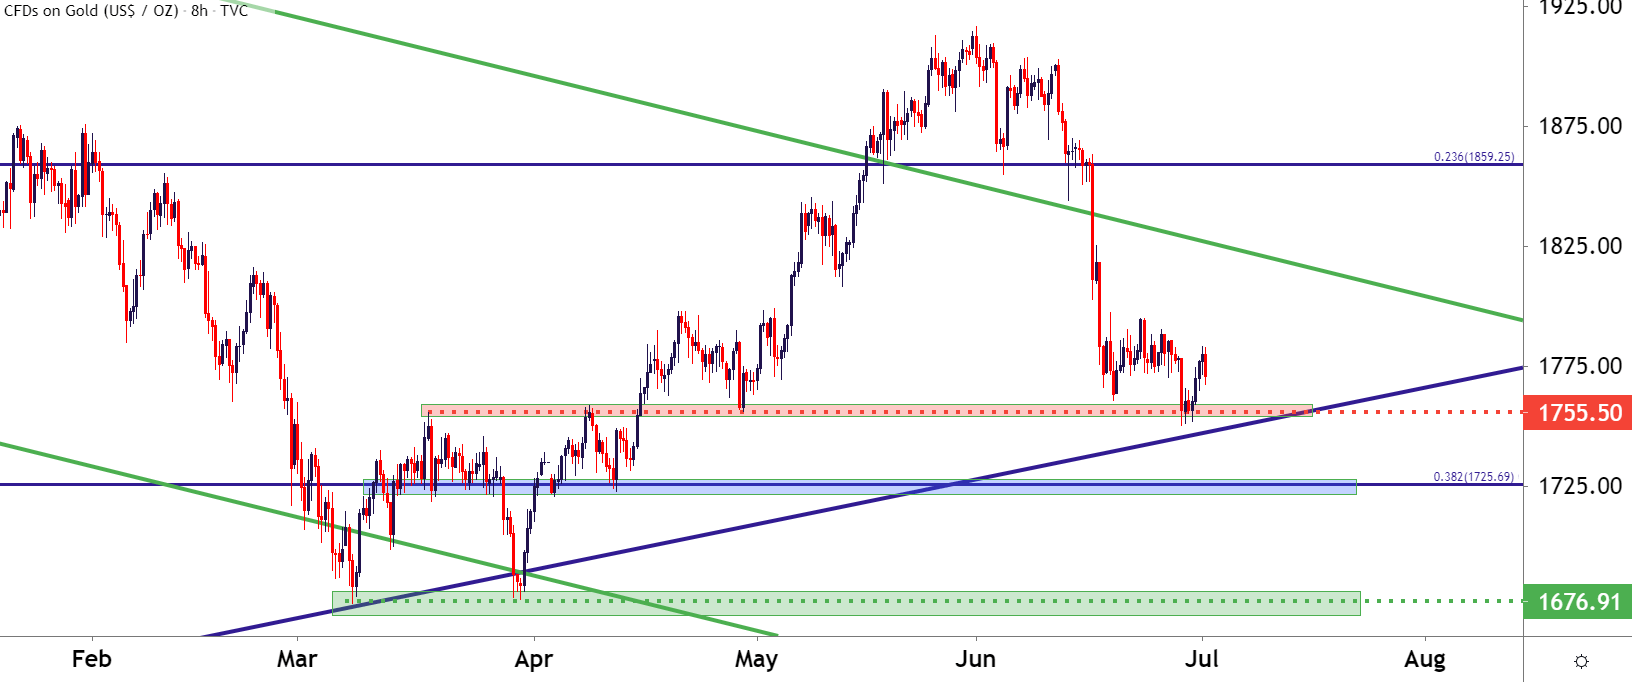
Chart prepared by James Stanley; Gold on Tradingview
--- Written by James Stanley, Senior Strategist for DailyFX.com
Contact and follow James on Twitter: @JStanleyFX


