


Gold Price Outlook Talking Points:
- Gold prices have opened the week at a key support level around the 61.8% retracement of the June-August major move.
- Short and Long-term strategies may favor Gold strength, while intermediate-term strategies may continue to look for bearish swing scenarios.
- The analysis contained in article relies on price action and chart formations. To learn more about price action or chart patterns, check out our DailyFX Education section.
Gold prices have now spent more than the past four months digesting after this summer’s bullish run. And to jog the memory, that bullish run over the summer saw Gold prices go into historical levels of overbought behavior as buyers just would not stop. But, after crossing the $2,000 level for the first time ever, setting a fresh all-time-high at $2,075 on August the 7th, prices began to retrace and that theme has pretty much remained ever since.
During this round of digestion, one area on the chart has continued to come in as key and this rests from 1859-1871: This zone caught support after that pullback first started in August and four months later, it came in as resistance last week to help hold buyers at bay. Last week saw prices fall from this zone, catching support at another key spot on the chart around 1823.
The big question at this point is one of direction: Are Gold bulls back to help further the bigger picture theme? Or, are bears gearing up for a larger move lower, looking to press those six-month-lows that were set just a few weeks ago. Unfortunately, the matter isn’t so clear from the as conflicting directions may show depending on the timeframes being followed: Both short and long-term strategies may favor continued strength while intermediate-term strategies may be set up for a continuation of weakness.
At this point, short-term strategies may favor Gold strength given this hold of higher-low support after last week’s resistance test. And key for this would be the Fibonacci retracement produced by the June-August major move, as the 76.4% retracement is what helped to set the low in late-November, along with the 50% marker helping to set the high last week. At current, the 61.8% retracement from that same major move is helping to hold the lows.
Gold Four-Hour Price Chart
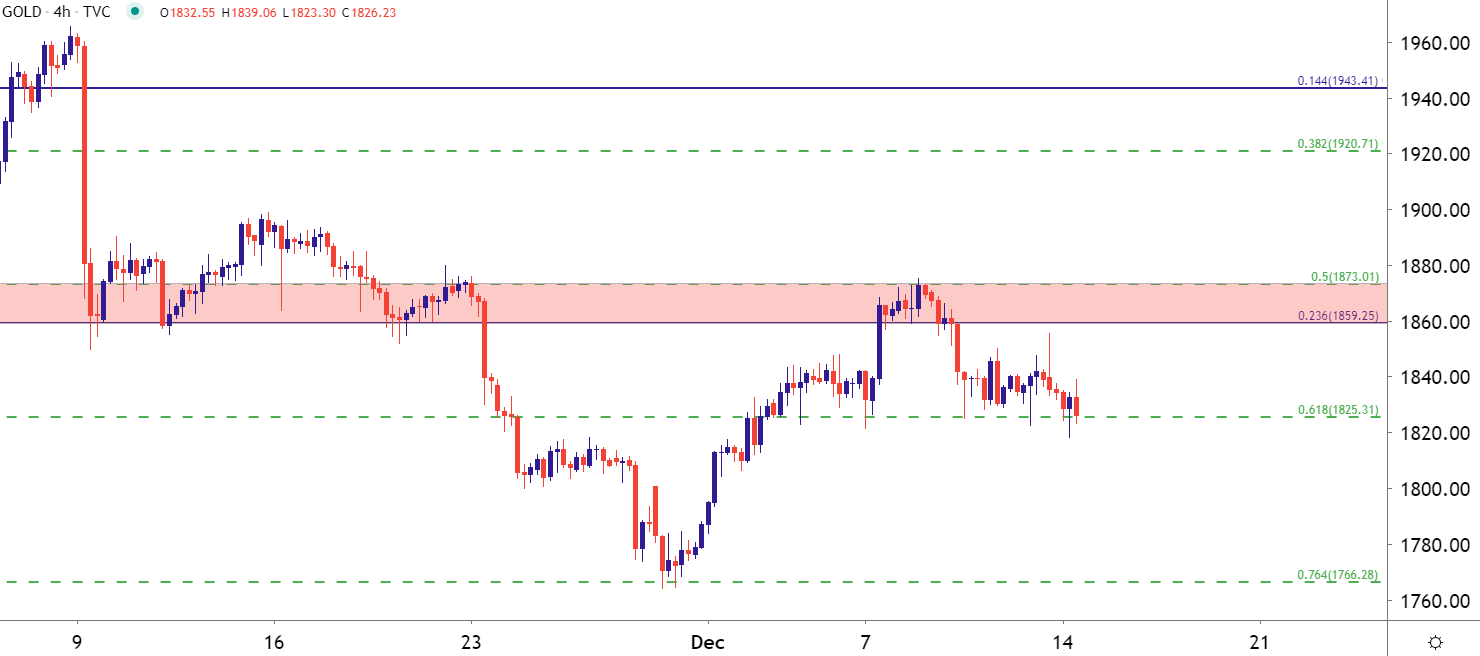
Chart prepared by James Stanley; Gold on Tradingview

From an intermediate-term vantage point, or for swing traders, the short side of Gold may be more attractive given the hold of resistance at that key zone of prior support. Also of interest, last week’s price action, following a really strong week printed as a doji. This indecision after a really strong week highlights the fact that the bulls driving from support may not be as bullish any longer; and there may be the potential for an evening star formation here should sellers continue to push this week. The evening start is often followed for bearish reversals, and given that that doji showed up at a key spot on the chart, the case could be strengthened for bearish scenarios from an intermediate-term timeframe.
Learn about 10 of the most popular candlestick patterns with DailyFX Education
Gold Daily Price Chart
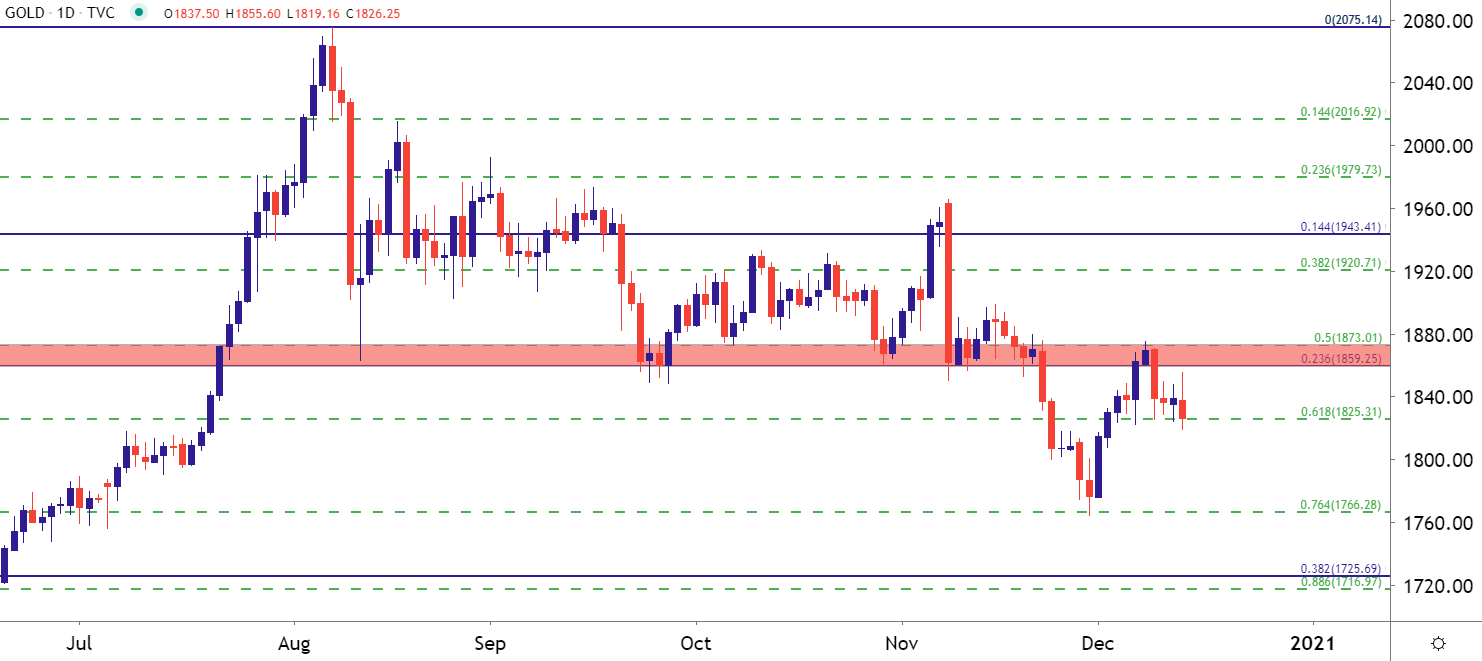
Chart prepared by James Stanley; Gold on Tradingview
Going back to a longer-term view, and there’s still scope for strength even after four-plus months of digestion. As a matter of fact, last year brought upon a similar theme, with near-term Gold prices topping out in August and then digesting into the second-half of December. Bullish Gold was my ‘Top Trade of the Year’ and as we move into 2021, many of the same facts remain with expectations for Central Banks to remain loose and passive.

We’ll hear more from the Fed on Wednesday as the bank updates their dot plot matrix, providing updated commentary on GDP and inflation projections for the first time since Covid vaccine news began to circulate. These all point to longer-term, big-picture themes and this is likely what will be needed to get Gold bulls back in the driver’s seat of the bid behind Gold prices.
Gold Weekly Price Chart
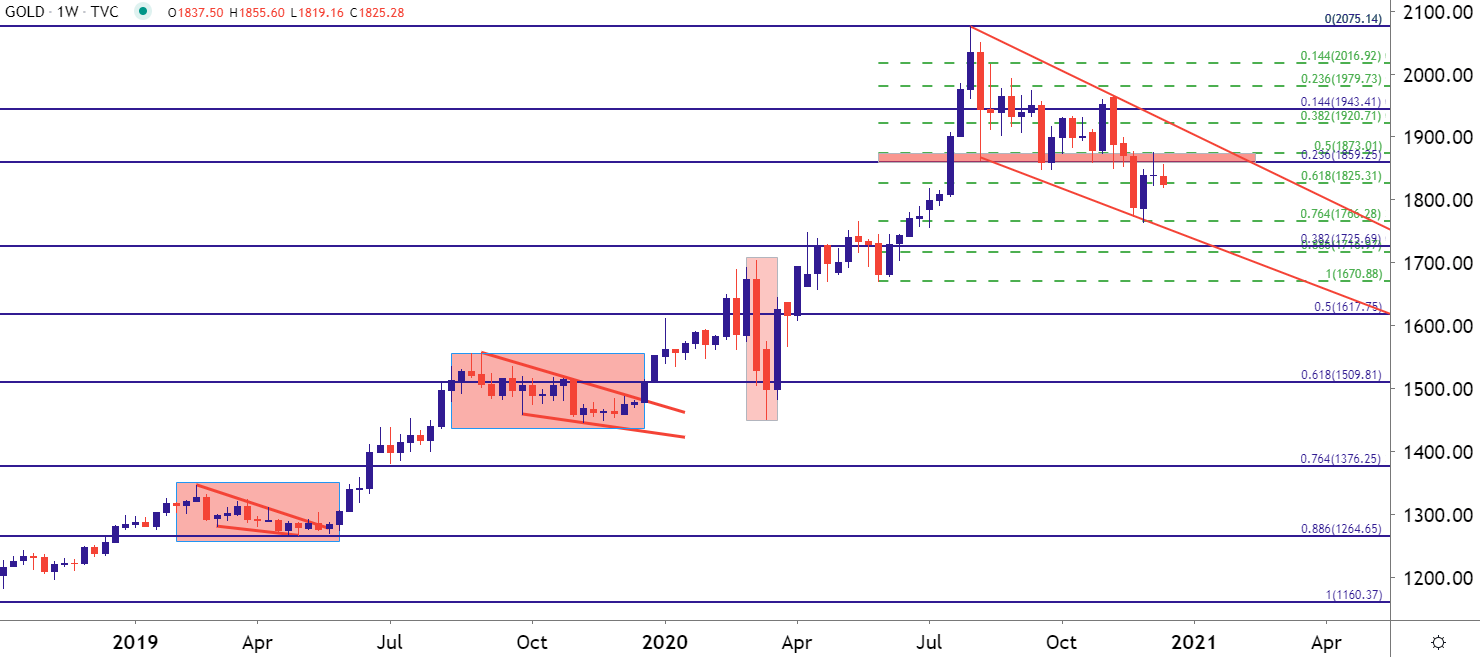
Chart prepared by James Stanley; Gold on Tradingview
--- Written by James Stanley, Strategist for DailyFX.com
Contact and follow James on Twitter: @JStanleyFX


