


Gold Price Forecast Talking Points:
- Gold prices broke down this morning on the back of USD-strength driven from the US PMI report.
- Gold prices set fresh four-month-lows, taking out a big zone of support along the way.
- The longer-term look in Gold still remains bullish as Gold price action continues to trade in the confines of a falling wedge formation.
- The analysis contained in article relies on price action and chart formations. To learn more about price action or chart patterns, check out our DailyFX Education section.
The surging bullish trend in Gold from this summer now feels a little further away…
Gold prices broke down this morning on the back of a really strong PMI print out of the US. That PMI print prodded the US Dollar higher and Gold, going along for the ride, broke down to fresh four-month-lows.
Perhaps the part of this that’s more interesting than the size of the move itself is where it happened; Gold prices had been testing the same support zone ever since early-August. This area between 1859-1871 included multiple Fibonacci levels from different studies, and it held numerous inflections over the past few months until buyers finally pulled back on the bid this morning, allowing for Gold prices to slide down to that fresh low.
It can seem very simple to get bearish on a move of this nature: But Gold bears should be very careful here given the longer-term backdrop, which we’ll look at below.
Gold Daily Price Chart: Fresh Four-Month-Lows as Big Support Traded Through

Chart prepared by James Stanley; Gold on Tradingview
Gold Prices – Bigger Picture
Taking a step back to look at the bigger picture on Gold – and the longer-term bullish cycle remains. Today’s sell-off has engaged with the 38.2% retracement of the 2020 major move, taken from the March low up to the August high.
That August high came into play on Aug 7th, topping out at a fresh all-time-high of $2075. But – that day’s price action closed with a bearish engulfing candlestick; and as noted in the technical forecast for that week, this opened the door for a contrarian move amidst that prior streak of strength. It didn’t take long for the pullback to develop as Gold prices gave back more than $200 in the first few days of the next week. But, that’s when the 1859-1871 support zone came into play, and remained in-play for much of the next four months until sellers were finally able to pose a break to start this week.
To learn more about bearish engulfing patterns, check out DailyFX Education
But the longer-term falling wedge formation still remains and the bigger-picture look can retain a bullish quality. But given the fact that Gold prices have just pushed to a fresh low, that longer-term bullish theme may have to remain in-wait, at least for now.
Gold Weekly Price Chart: Falling Wedge Formation Remains
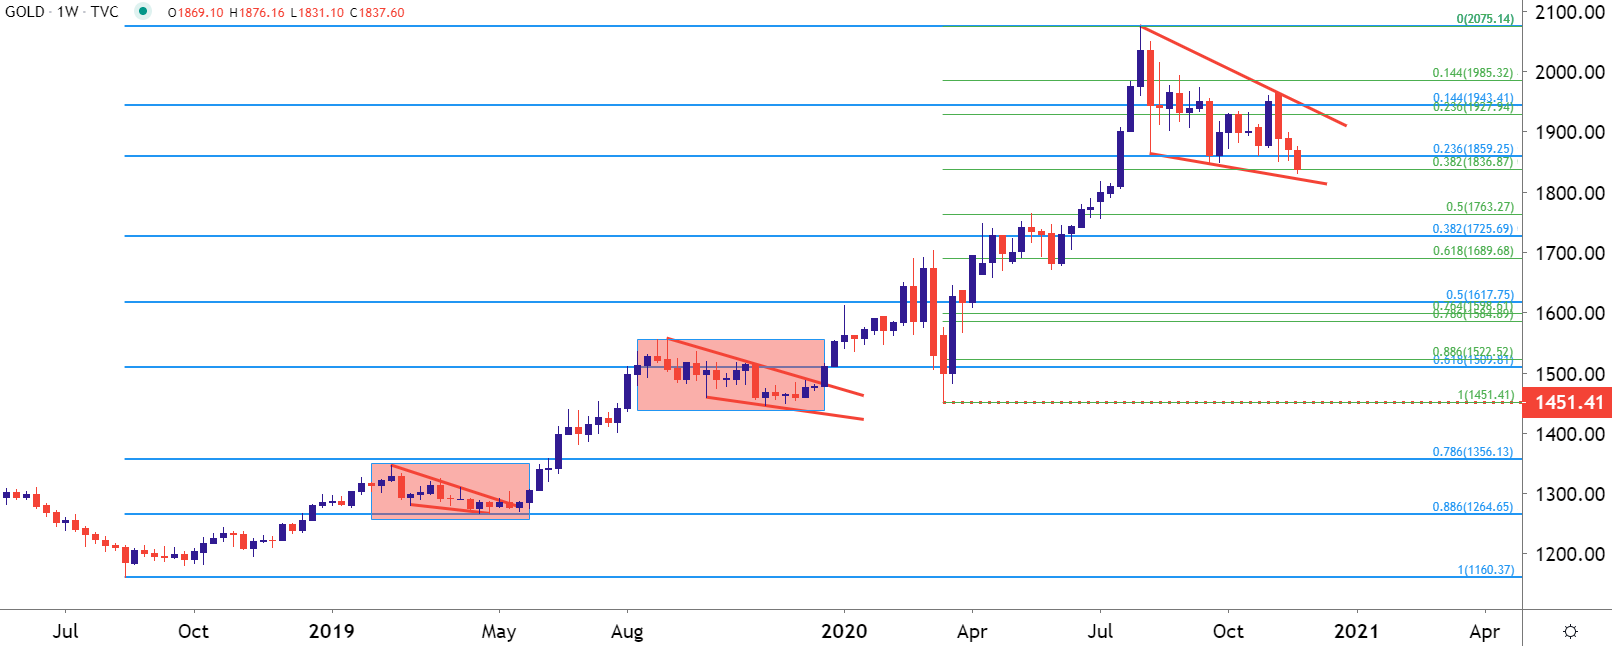
Chart prepared by James Stanley; Gold on Tradingview
Gold Price Near-Term Strategy
With Gold putting in a mild bounce after those fresh four-month-highs, there may be scope for both bulls and bears here to implement some form of strategy.
On the bearish side, for those looking at a continued sell-off in Gold prices, that prior zone of support could become resistance potential. This zone runs from 1859-1871 and has seen a number of recent support tests.

Gold Four-Hour Price Chart
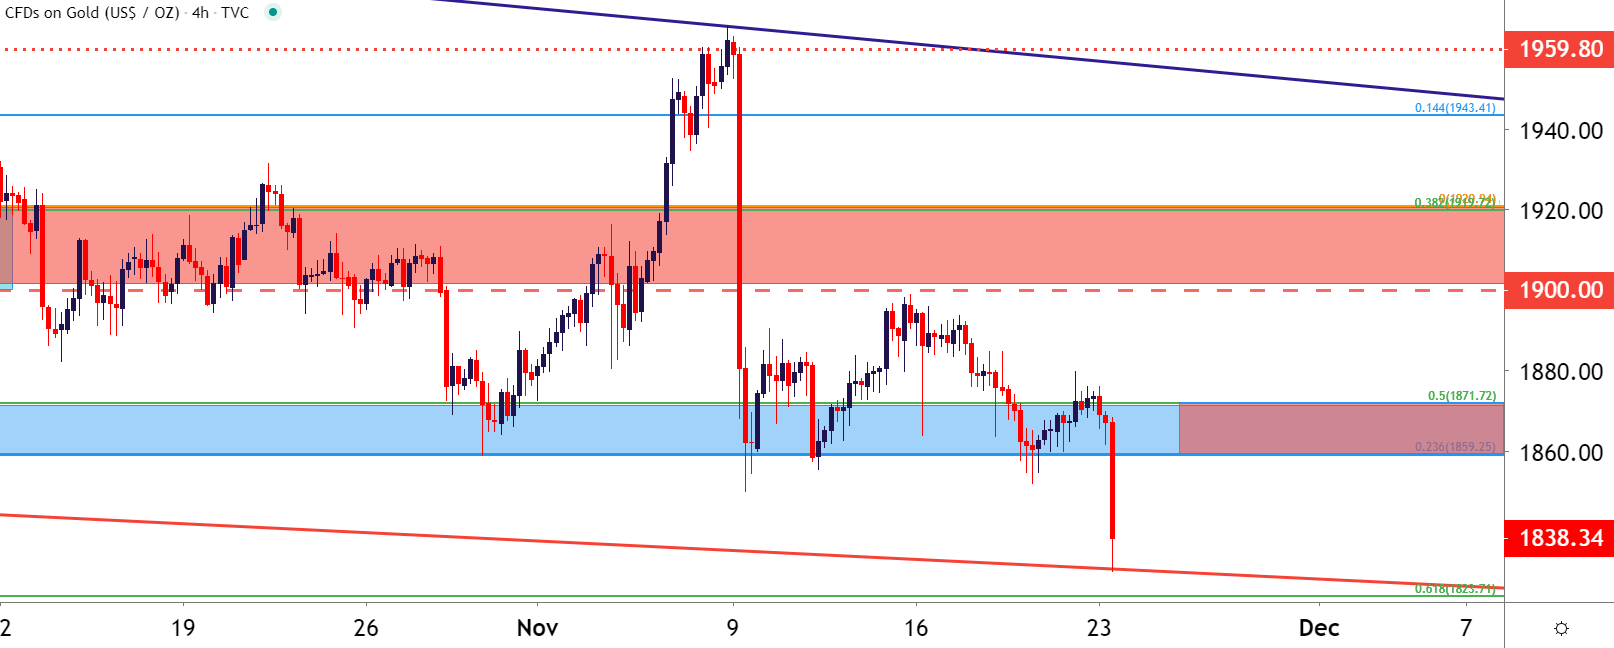
Chart prepared by James Stanley; Gold on Tradingview

For Gold bulls, this downside break may actually be somewhat welcome…
As looked at over the past couple of months, this digestion has remained in-place with a few different fits and starts. There’ve been a number of false breakouts and each time Gold has pushed up to a fresh high, buying pressure has stalled and sellers have come into play. This could be emblematic of an overbought backdrop from that summer bullish run, as buyers were holding on to positions in anticipation of topside continuation.
Of course, with today’s push down to fresh four month lows, there’ve likely been a number of stops from these traders get triggered, which initially exacerbated the sell-off with that supply coming online. But – this also means that there’s possibly now more money on the sidelines that could assist with a bullish continuation scenario if/when buyers are able to substantiate support.
For that longer-term look for Gold bulls, re-claiming the 1859 level is a good first step; and a follow-through item of support around that level could give the appearance that bulls are getting back in order.
To learn more about falling wedge patterns, check out DailyFX Education
Gold Daily Price Chart
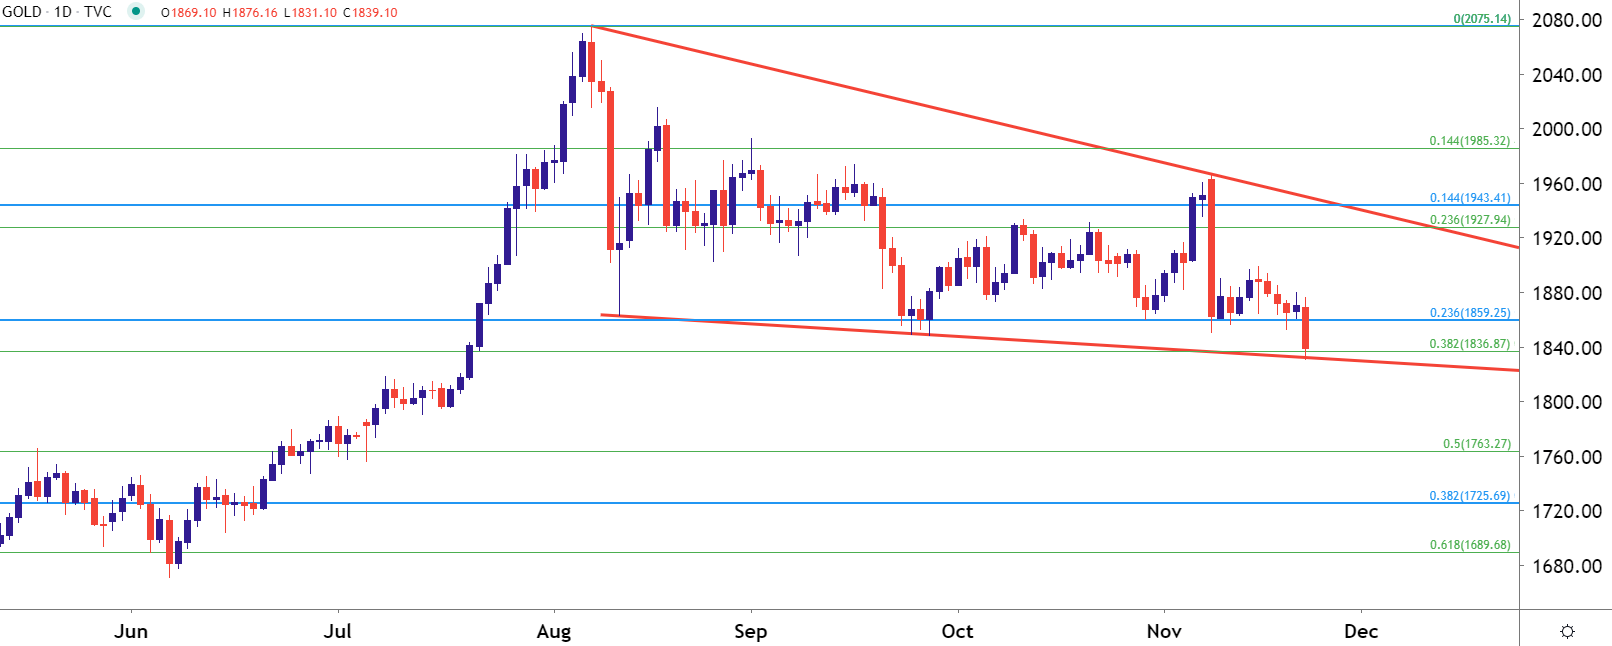
Chart prepared by James Stanley; Gold on Tradingview
--- Written by James Stanley, Strategist for DailyFX.com
Contact and follow James on Twitter: @JStanleyFX


