


Gold Price Analysis
- Gold prices are starting the week with strength after interacting with a key support zone last week.
- Last week saw Gold prices lose as much as -4.4% from the high to the low.
- Gold prices remain in overbought territory via RSI on the monthly chart, but are bulls willing to wait or is that theme of strength nearing a return?
Gold Prices Fall into Key Support Through NFP
We’re not even through half of the year yet and it’s already been one for the record books, in a variety of ways. After an unprecedented level of market volatility in March and into April, Gold prices have shown a general tendency to range over the past month as markets gear up for whatever is next.
While the initial carnage was very visible in global equities, that aggressive turn-around which helped to drive the Nasdaq 100 to an even-higher all-time-high illustrates just how strong the buy the dip move has been. This, of course, was helped along by some considerable support from global governments, key of which was the US, as multiple stimulus programs were enacted in the effort of off-setting the economic destruction from the novel coronavirus. This brings up the prospect of USD weakness, particularly as the potential for continued government support remains.
That hope took a bit of a hit last week on the blowout NFP number that caught so many by surprise. While most economists were looking for yet another month of bad data, job losses and rising unemployment the actual print came out in a very different way – showing the most jobs added in a month – ever. That gave a quick shot of strength to US equities helping to drive the Nasdaq to that fresh high; and Gold prices suffered as sellers took-control and broke prices down to a fresh monthly low, with a support assist showing at the same price that held the lows in late-April.
Gold Four-Hour Price Chart

Chart prepared by James Stanley; Gold on Tradingview
Taking a step back to provide some context, and Gold prices are trading around a very interesting zone of support. I had looked at this support a couple of weeks ago as a very overbought Gold market continued to march-higher, and as looked at last week, that bullish charge continued into deep overbought conditions on long-term charts, eventually running into a Fibonacci level around the $1742.50 market on the chart.

Since then, Gold price action has been making lower-lows and lower-highs, leading into last week’s sell-off followed by the early-week support bounce around this very key zone on the chart.
Gold Eight-Hour Price Chart
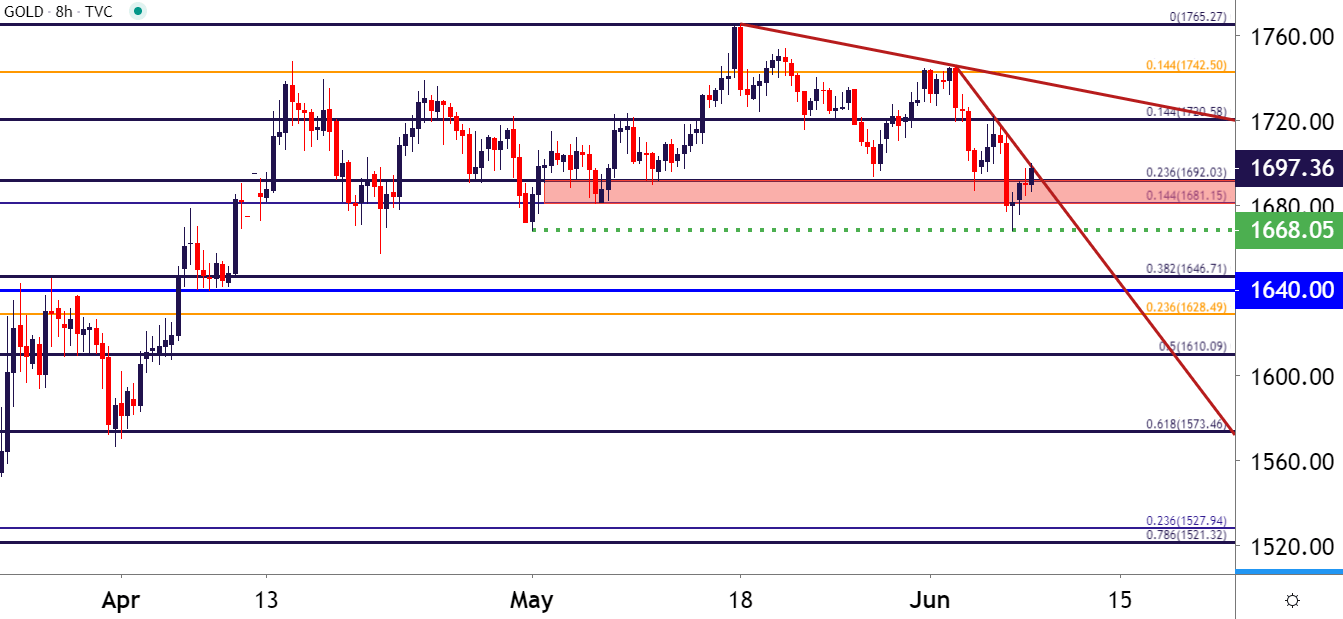
Chart prepared by James Stanley; Gold on Tradingview
Gold Price Strategy: Deeper Correction or Return of the Bulls?
As looked at last week, Gold prices moved to their most overbought level since 2011, when Gold prices topped out and then began a sell-off that lasted for a couple of years after. And outside of that – there were but two other instances of RSI getting that overbought on the monthly chart. With such a small sample size, it can be difficult to build accurate inferences: So an overbought reading of that level isn’t necessarily a motivator to sell as much as it is a point of caution from chasing the move higher.
And since prices topped-out at that Fibonacci level last week, Gold prices have lost as much as -4.4% from last week’s high down to last week’s low.
But with that support zone coming into play and bulls making a visible show in the early-portion of this week, the big question is whether the topside trend is ready to continue. From the hourly chart below, there may be some possible scope of continuation given the higher-highs and higher-lows that have begun to form; placing emphasis on a re-claim of the 1700 level which would establish yet another higher-high. Also of interest, there’s a trendline that’s starting to come into play, taken from the lower-highs last week with inflections on Tuesday and Thursday.
Gold Price Hourly Chart

Chart prepared by James Stanley; Gold on Tradingview
--- Written by James Stanley, Strategist for DailyFX.com
Contact and follow James on Twitter: @JStanleyFX


