


Gold Price, XAU, GLD Analysis:
- Gold prices are up by more than 50% from the August, 2018 low.
- Gold prices have continued to push higher as expectations have built for global Central Banks to remain very loose and passive with monetary policy for the foreseeable future.
- Gold prices have moved well into overbought territory on the monthly chart, to levels not seen since Gold prices topped-out in August of 2011.
Gold Prices Soften From Seven-Year-Highs, Bounce from Support
Gold prices have put in a strong bounce from support over the past two days, and this follows a week of retracement after the precious metal had pushed up to yet another fresh seven-year-high. As looked at last week, just as Gold prices were setting that fresh high-watermark, FOMC Chair Jerome Powell communicating to markets that there was ‘no limit’ to what the Fed could do with the lending programs available helped to fire Gold prices higher. This helped the yellow metal to test above the $1750/oz level for the first time since 2012 and stocks have enjoyed a significant rally, as well.
Since then, however, that bullish trend in Gold had calmed and price action has pushed down towards the second zone of support looked at in that article last week. Yesterday saw price action tip-toe down to the 1692 level, but bulls came in a little early to help set a fresh two-week-low at 1693.55. Prices have since bounced but there’s a very apropos question of whether buyers are yet ready to rekindle that bullish trend or whether a continued retracement is waiting in the wings. For context, we must look at the bigger picture.
Gold Four-Hour Price Chart
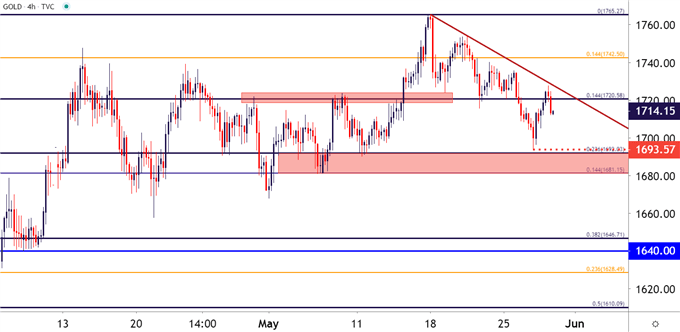
Chart prepared by James Stanley; Gold on Tradingview
Gold Prices: The Bigger Picture
Markets often move in cycles, and depending on the market practitioner’s philosophy, these cycles can occur on short or long-term basis, and perhaps even in tune with grander ‘super-cycles’ that can impact a wide swath of commodities at the same time.
Taking a longer-term, bigger-picture look at Gold prices and at least a couple of cycles become evident. Starting with the March 2008 temporary high, Gold prices sold off by almost 34% during the depths of the financial collapse; eventually bottoming-out in October of 2008 shortly after news of Lehman Brothers impending bankruptcy made its way through markets. From there – Gold prices went on a rip-roaring rally for the next three years, running from a low of 666 up to a high of 1910 – a move of 287% in a little under three years.

But after topping in 2011, as markets were gearing up for the Fed to eventually begin normalizing rates and focusing on tighter policy, Gold prices retraced and, eventually, began to range. That lasted well into 2018 at which point the Q4 open brought an entirely new situation to the table.
In the opening days of Q4, 2018, Jerome Powell spoke about the Fed’s expectations for rates, and the head of the FOMC said that he felt that the neutral rate was ‘a long way off.’ This is key, as the neutral rate is somewhat of a goldilocks destination for the Central Bank, striking that ideal interest rate that is neither simulative nor restrictive. After the Fed had already hiked rates three times in 2018 (and three times in 2017), markets began to show a theme of risk aversion with stocks selling off under the anticipation that the Fed might continue hiking.
Gold prices, however, seemed to take on a different tone, as strength began to show in October of 2018 and continued through the end of the year. When the Fed eventually backtracked from those 2019 rate hike probabilities, Gold prices flew-higher last summer as it became clear that the FOMC was shifting into a dovish stance and, perhaps, might even see the bank cut rates.
Gold Prices Monthly Chart
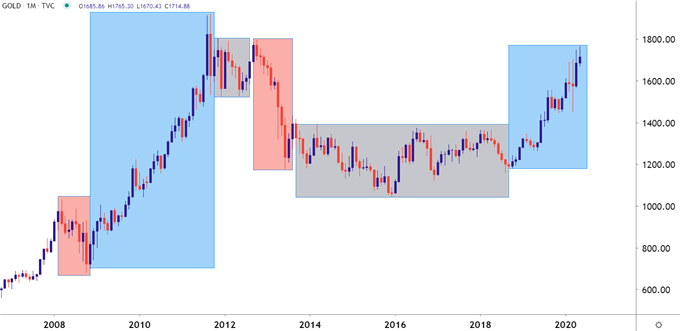
Chart prepared by James Stanley; Gold on Tradingview
That bullish trend in Gold shows quite visibly in the below daily chart of the precious metal. Of particular interest is the significant gyration showing in early-March of this year, as Gold prices sold off by almost a full 15% in about two weeks – followed shortly after by a 20% rally as bulls jumped on the bid.
Gold Prices Daily Chart
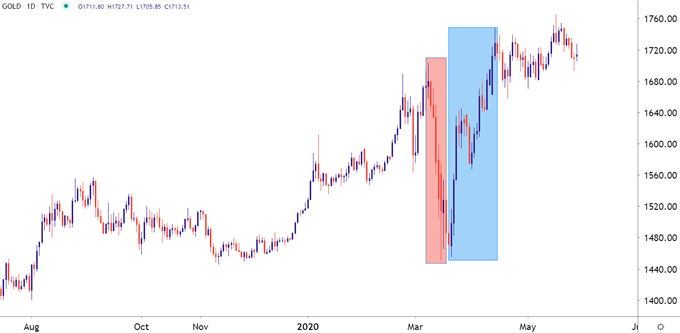
Chart prepared by James Stanley; Gold on Tradingview
The Fed, and global Central Banks, have been quite busy lately. And that’s likely to continue, at least as long as the world is wrestling with the novel coronavirus. Literally no one knows for how long that might continue, and even when a vaccine or medicinal treatment is found, it’s going to take time for economies to rebuild to their prior state. They’re likely going to need some Central Bank support and, at this point, there’s nothing to suggest that markets won’t get that.

This can also be a big driver to Gold prices, perhaps even similar to the 2008-2011 run as the yellow metal was gaining on the back of Central Banks rushing to the aid of global markets.
One significant concern at the moment is just how fast this bullish trend has priced-in and how aggressively buyers have continued to support the bid. Going back to the monthly chart, and RSI is at its most overbought since 2011, right when Gold prices topped-out; and the prior instance of RSI on the monthly chart of Gold going above 75 was in 2008, just before the pre-financial collapse top. In full transparency, the instance of RSI above 75 before that was in 2006 and Gold prices continued to rally for almost two years after.
Gold Price Monthly Chart
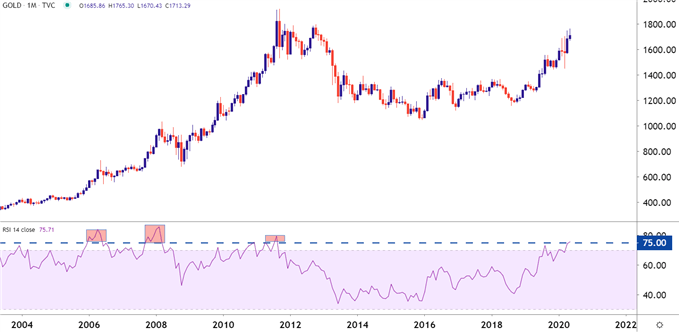
Chart prepared by James Stanley; Gold on Tradingview
With the above chart and the bigger-picture backdrop in mind, the trader can then move on to the incredibly challenging aspect of timing. There are a few nearby support zones of interest and that can keep buyers focused on the bid, looking for continuation of this recent bullish theme. On the below four-hour chart, I’ve outlined two possible such areas of interest nearby recent price action, including the support zone mentioned last week that has yet to come into play with buyers showing up ahead of a test at 1691.
Gold Price Four-Hour Chart
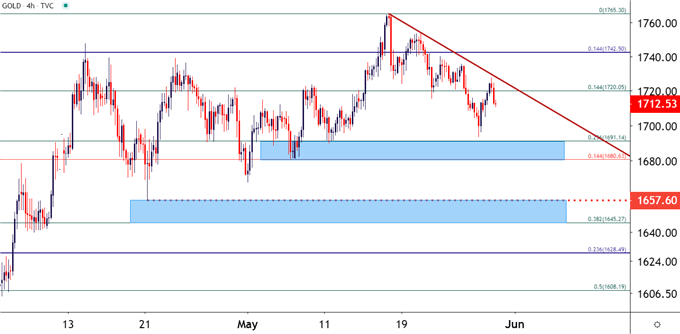
Chart prepared by James Stanley; Gold on Tradingview
--- Written by James Stanley, Strategist for DailyFX.com
Contact and follow James on Twitter: @JStanleyFX


