


S&P 500 Price Analysis
- In a positive development, the S&P 500 did not hit limit down after this week’s open for US equity futures.
- The support that came into play for the S&P 500 after last Sunday’s open has since held, plotted around the 76.4% Fibonacci retracement of the 2016-2020 major move.
- This Friday’s NFP report is expected to show a loss of -100k jobs in the US with a rise in the unemployment rate to 3.8% from last month’s 3.5%. But both of those estimates may be a bit light given the severity of the slowdown.
S&P 500 Climbs from Support, Builds on Last Week’s Bounce
This week marks the end of what’s been a brutal month of March, and as the door opens into April a number of data items are on the calendar for this week, headlined by the Friday Non-Farm Payrolls report out of the United States. The forecast for NFP is for a loss of 100k jobs in the most recently completed month, but given last week’s initial jobless claims of 3.2 million, that -100k expectation may be a little light. The unemployment rate is expected to scale up to 3.8% from last month’s 3.5% but, again, this estimate may be wildly off track as a new, violent economic disruption showed up in the month of March.
Markets are forward-looking, however, and the argument can be made that the carnage that was seen through the month of March was pricing in this anticipation for massive job losses and a rising unemployment rate. On the bright(er) side, this week’s open wasn’t quickly followed by US equity futures quickly hitting the ‘limit down’ barrier, the first time that’s happened over the past few weeks. And as looked at last Friday, the S&P 500 appears to have finally found some element of support following last week’s brutal open that quickly saw S&P 500 futures jump to that limit down barrier and hold support through Monday trade.

That support comes-in around the 76.4% retracement of the 2016-2020 major move. The 61.8% Fibonacci retracement from that same study came into help set support on Wednesday and Thursday; and now price action is testing the same 50% marker that helped to set resistance last week.
S&P 500 Four-Hour Price Chart
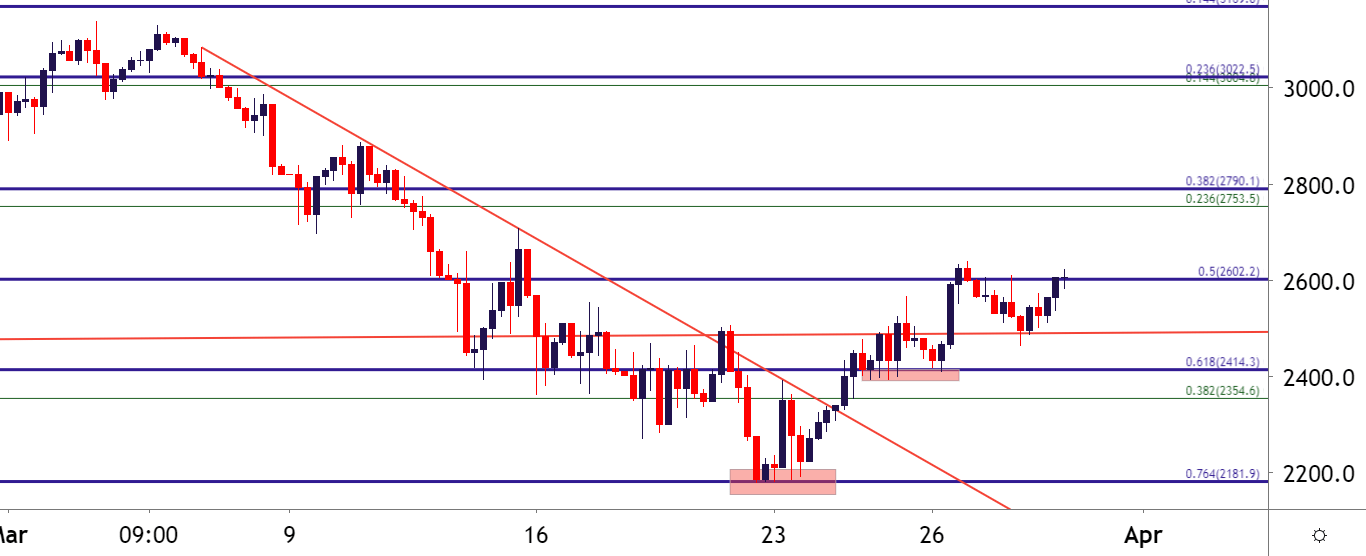
Chart prepared by James Stanley; SPX500 on Tradingview
Taking a step back on the chart, and the extreme volatility of recent becomes a bit more obvious, illustrated by an underside wick of approximately 500 handles currently showing on the not-yet-completed monthly bar. This is approximately 19% of the index’s value, and that’s merely the amount that’s been clawed back over the past week.
And the argument on either side of the scenario is still a loaded theme: The novel coronavirus continues to spread and most data seems to indicate that we’re not yet near a peak in the United States. The length of the shutdown is unknown as is the potential for economic contraction, which is why these early data releases such as Friday’s Non-Farm Payrolls report can be so incredibly important, as it’ll help to gauge just how severely the US economy has been hit by this new theme.
On the other side of the matter and likely at the source of this recent bullish demand – Congress and the Federal Reserve have launched a trove of stimulus measures. They don’t yet appear finished, either, as this could lead to the largest fiscal and monetary expansion that the world’s ever seen. So, while there’s likely to be continued impact to local economies through the US, there’s also likely to be an extreme form of accommodation coming from governments attempting to support those economies.
Whether or not it’s enough to stem the economic damage of a near-global shutdown remains to be seen; and it’s that very same ‘price discovery’ that’s likely to lead to continued volatility in the days, weeks and, perhaps even months ahead.
S&P 500 Monthly Price Chart
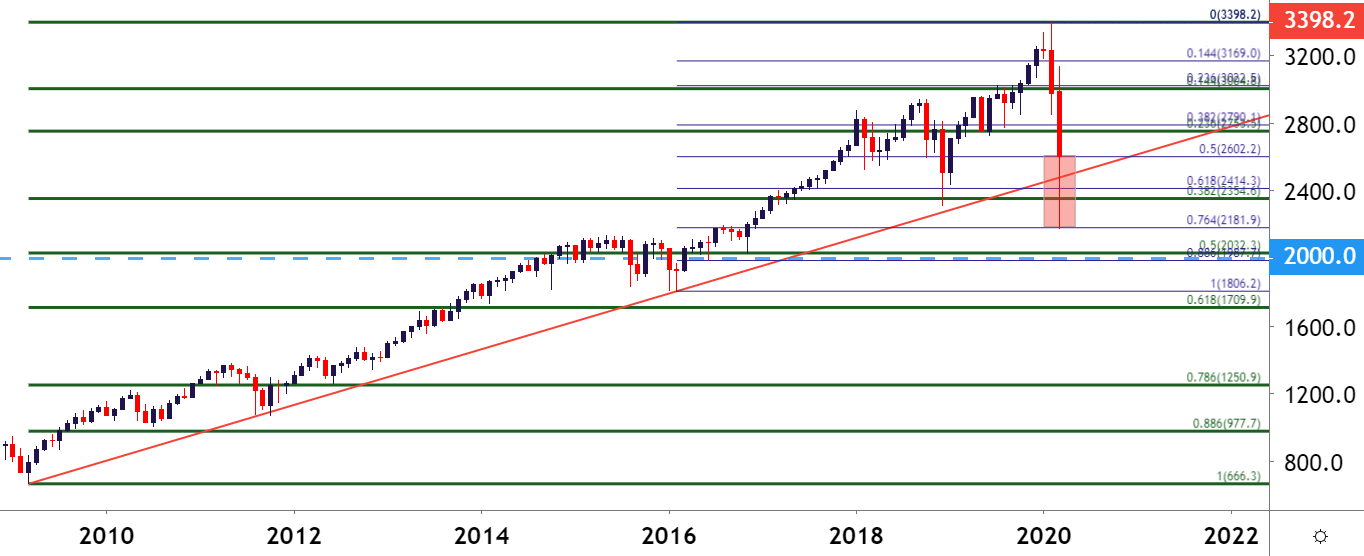
Chart prepared by James Stanley; SPX500 on Tradingview
--- Written by James Stanley, Strategist for DailyFX.com
Contact and follow James on Twitter: @JStanleyFX


