


S&P 500, US Dollar Talking Points
- It’s been a month of extremes in global markets as a shocking and historically aggressive equity sell-off finally found some semblance of support this week.
- The US Dollar put in a strong rally as risk aversion was heating up in the middle of March, gaining as much as 8.8% over a ten-day-period.
- With the S&P 500 digging into support and the US Dollar tempering gains, both reactions to recent FOMC actions – the big question now is whether the worst is over or whether there’s more selling yet to come.
S&P 500 Finds Support After Limit-Down Sunday Open
We’re nearing the close of what’s been another eventful week across global markets. The big question at this point is whether a low has been set in US equities as a trove of various stimulus measures from the Federal Reserve may have finally helped to bring some support into play.
Weekend risk remains a daunting prospect, however, as the past couple of weeks have seen US equity futures go ‘limit down’ after the Sunday open – even with big announcements from the Federal Reserve designed to do the exact opposite. But, grading the performance of the US Dollar combined with a bright patch of performance in US equities after what had become a brutal backdrop – hope remains that risk aversion may finally be taking a rest.
In the S&P 500, the big item this week was price action moving into a technical ‘bull market,’ denoted by a bounce of 20% or more which showed from the Monday low up to the Thursday high. This comes just a couple of weeks after the S&P 500 had moved into ‘bear market’ territory, designated as a sell-off of 20% or more. With the paring of those gains on Friday, the ‘bull market’ argument doesn’t really hold at this point but did for a brief observation after the Thursday close.
S&P 500 Daily Price Chart
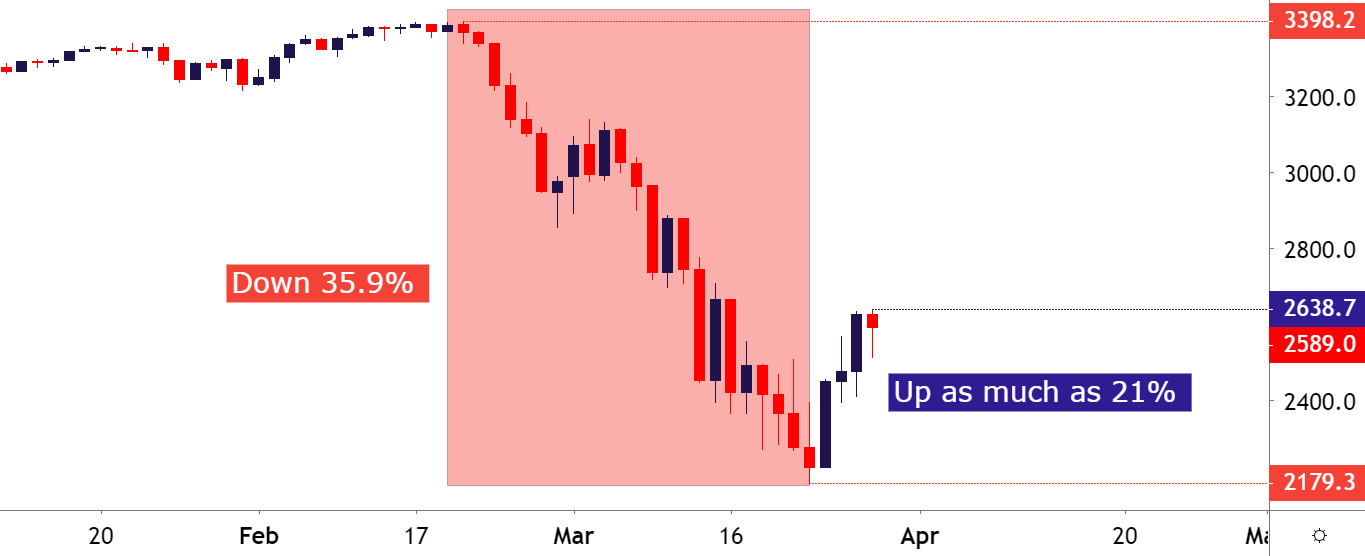
Chart prepared by James Stanley; SPX500 on Tradingview
Making matters a bit more complex – the 20% rally that showed Monday thru Thursday cut the total loss on the S&P 500 (from the February high) to 22.5%. That number had grown to 35.9% after last Sunday’s open so – even though US equities temporarily moved into that ‘bull market’ status – the argument can be made that a bigger bear market persists and this week’s bounce was but a pullback or retracement in a bigger-picture theme.

Arguments on Both Sides of the Risk Trade
We’re still seeing history take place in front of us. Never has the world seen so much economic accommodation ushered in so quickly. During the Financial Collapse in 2008, it took months and months to accomplish what took a few weeks here, with both the Fed and Congress opening up stimulus measures designed to offset the economic slowdown emanating from the spread of the novel coronavirus, which is another item of history that’s taking place before us.
There’s not really a template for how a society should or can most adequately handle a pandemic scenario. Sure, the ‘Spanish Flu’ presents some evidence but this was more than 100 years ago and the world, and financial markets, were in a much different spot at the time. Most evidence suggests there hasn’t yet been a peak in cases and, until there is, it’s difficult to project just how long or how aggressively this slowdown might cut into the American and, in turn, the global economy.
So, there’s rationale for why US equities sold-off so aggressively in such a short period of time, marking another historical item in just how quickly that sell-off showed up. As looked at earlier this week, a big zone of longer-term support came into play in the S&P 500 and, has since helped to hold the lows.
S&P 500 Monthly Price Chart
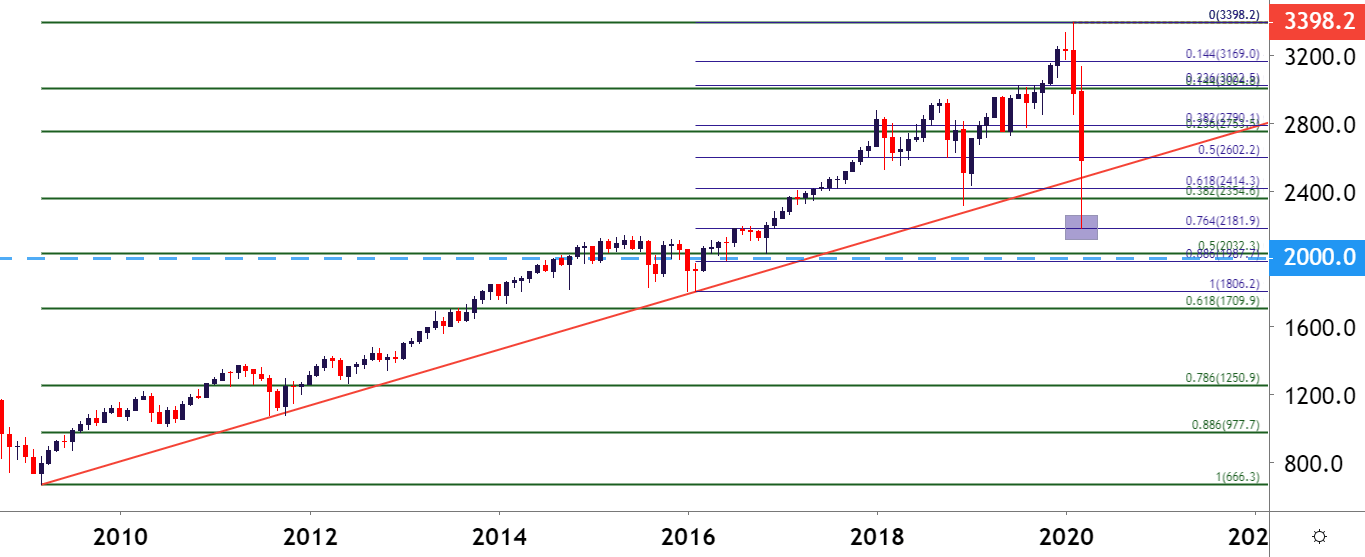
Chart prepared by James Stanley; SPX500 on Tradingview
US Dollar Snaps Back
This extreme uncertainty had led to a massive move of strength in the US Dollar, with the currency jumping by as much as 8.8% in a ten-day-span in the middle of March. And given the extreme volatility that had shown in Treasuries, it made sense as to why there was so much risk aversion showing as global flows drove into cash. Treasury markets have since calmed, and the US Dollar has softened in response, giving back more than 50% of that prior bullish move.
US Dollar Four-Hour Price Chart
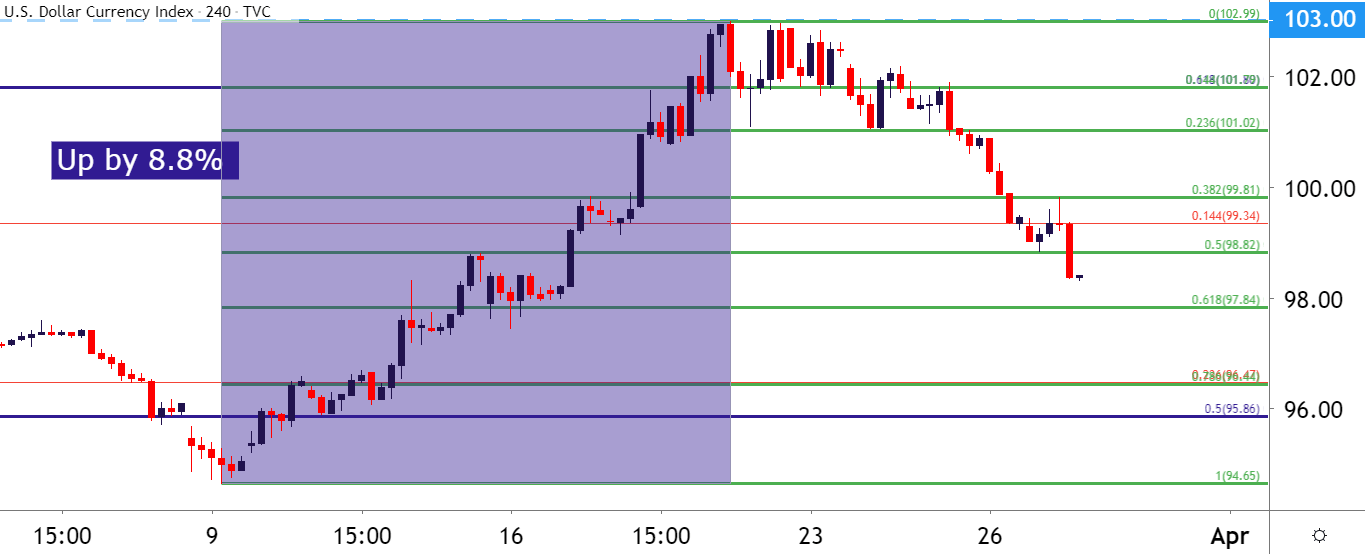
Chart prepared by James Stanley; USD on Tradingview
With now just two trading days left in the month, the monthly price bar on the US Dollar is showing as a long-legged doji, a sign of extreme indecision. Notably, resistance played-in just ahead of the 103.00 level on DXY last week, the same zone that turned around a bullish advance in December 2016 and January of 2017. A break-above the 103.82 level, should bulls continue to push, would constitute a fresh 17-year-high in the currency.
US Dollar Monthly Price Chart
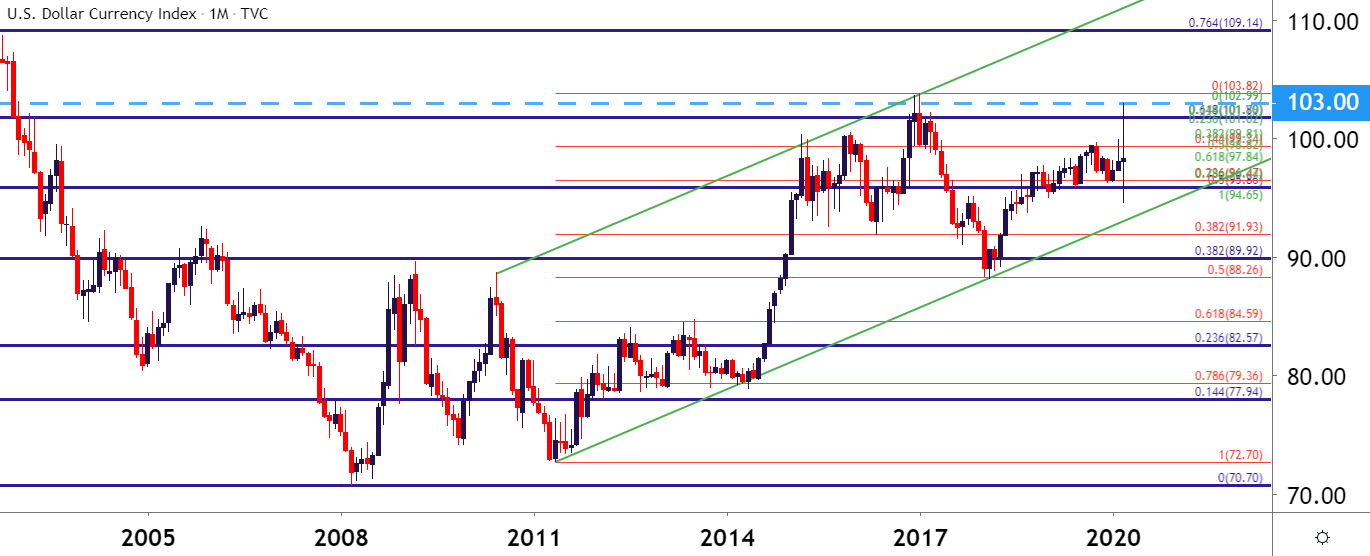
Chart prepared by James Stanley; USD on Tradingview
--- Written by James Stanley, Strategist for DailyFX.com
Contact and follow James on Twitter: @JStanleyFX


