


Canadian Dollar Price Outlook Talking Points:
- It’s been a virtual wash so far in Q4 for USD/CAD as the October sell-off as soundly reversed in the month of November, leaving price action just under a key zone of longer-term resistance.
- USD/CAD is showing short-term price action as a bull pennant formation, which will usually be approached with the aim of topside continuation. The lurking resistance zone can make that approach a bit less attractive given the current backdrop.
- DailyFX Forecasts are published on a variety of markets such as Gold, the US Dollar or the Euro and are available from the DailyFX Trading Guides page. If you’re looking to improve your trading approach, check out Traits of Successful Traders. And if you’re looking for an introductory primer to the Forex market, check out our New to FX Guide.
USD/CAD Spends November Clawing Back October Losses – Now What?
We’re now two-thirds of the way through Q4 and already a couple of strong trends have shown in the US Dollar. An outsized sell-off in the month of October was retraced in November as USD price action shot-up to the 50% marker of that prior move and held resistance into month-end. In USD/CAD, however, that November bounce was more aggressive, retracing as much as 93% of the October sell-off before settling into a round of digestion in the final week of the month.
At this point, USD/CAD price action is holding in a bull pennant formation, marked by a symmetrical wedge sitting atop a recent bullish trend. Just overhead, however, is an imposing group of resistance levels that have helped to hold the highs in the pair since June of this year, thereby adding complication to bullish breakout scenarios as top-end profit targets may remain capped in the near-term.
USD/CAD Eight-Hour Price Chart
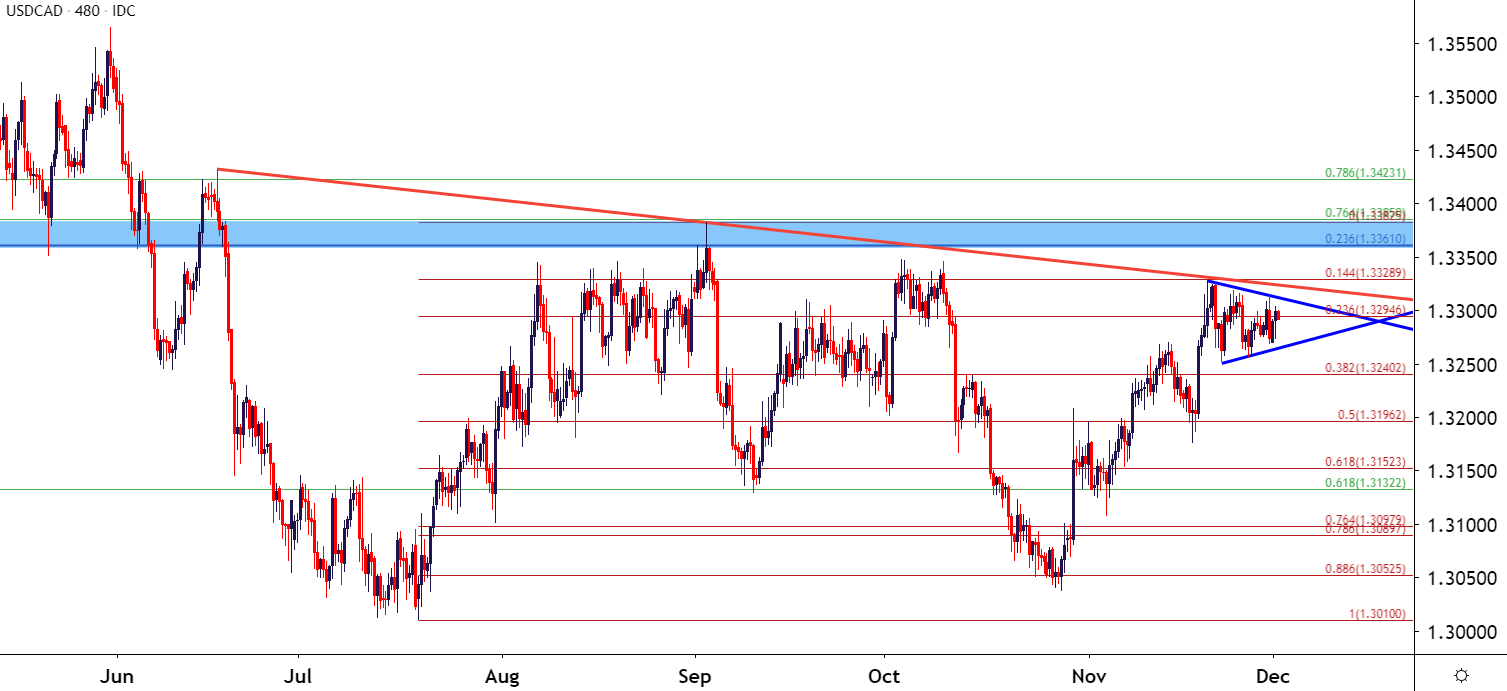
Chart prepared by James Stanley; USDCAD on Tradingview
The next 100 pips above current price action could be especially turbulent as this zone has already turned around a number of advances so far in the second-half of this year. The level of 1.3361 is 23.6% Fibonacci retracement of the 2007-2016 major move in the pair, while 1.3385 is the 76.4% marker of the 2017 sell-off. This zone helped to mark the swing-highs in June of last year and January of this year, soon becoming swing support in May until sellers re-took control in June. Most recently, this area of the chart came in to mark the September swing-highs as there was a bit of capitulation from buyers.
This zone is likely one of the reasons the October highs fell short of this area as buyers thought twice about a re-test. This led to a lower-high and a similar instance appears to be taking place right now as yet another group of lower-highs have been forming over the past two weeks.
USD/CAD Daily Price Chart

Chart prepared by James Stanley; USDCAD on Tradingview
USD/CAD Near-Term Support, Long-Term Resistance
Over the past couple of weeks I’ve looked to USD/CAD for short-term bullish plays, basing off of a zone of shorter-term support that’s shown in this recent round of digestion. That support runs from 1.3250-1.3270 and so far has held two separate support tests. But buyers haven’t yet been able to make a lasting mark as each of those support tests have merely led into lower-highs, leading into the build of the symmetrical wedge formation; and when that wedge formation is taken in consideration of the prior bullish move, that makes for a bull pennant.
Bull pennants will often be approached with the aim of topside continuation. In this scenario, however, given the context of longer-term resistance lurking above current prices, and that approach could be less attractive as topside potential for bullish breakouts could be seen as capped.
USD/CAD Four-Hour Price Chart
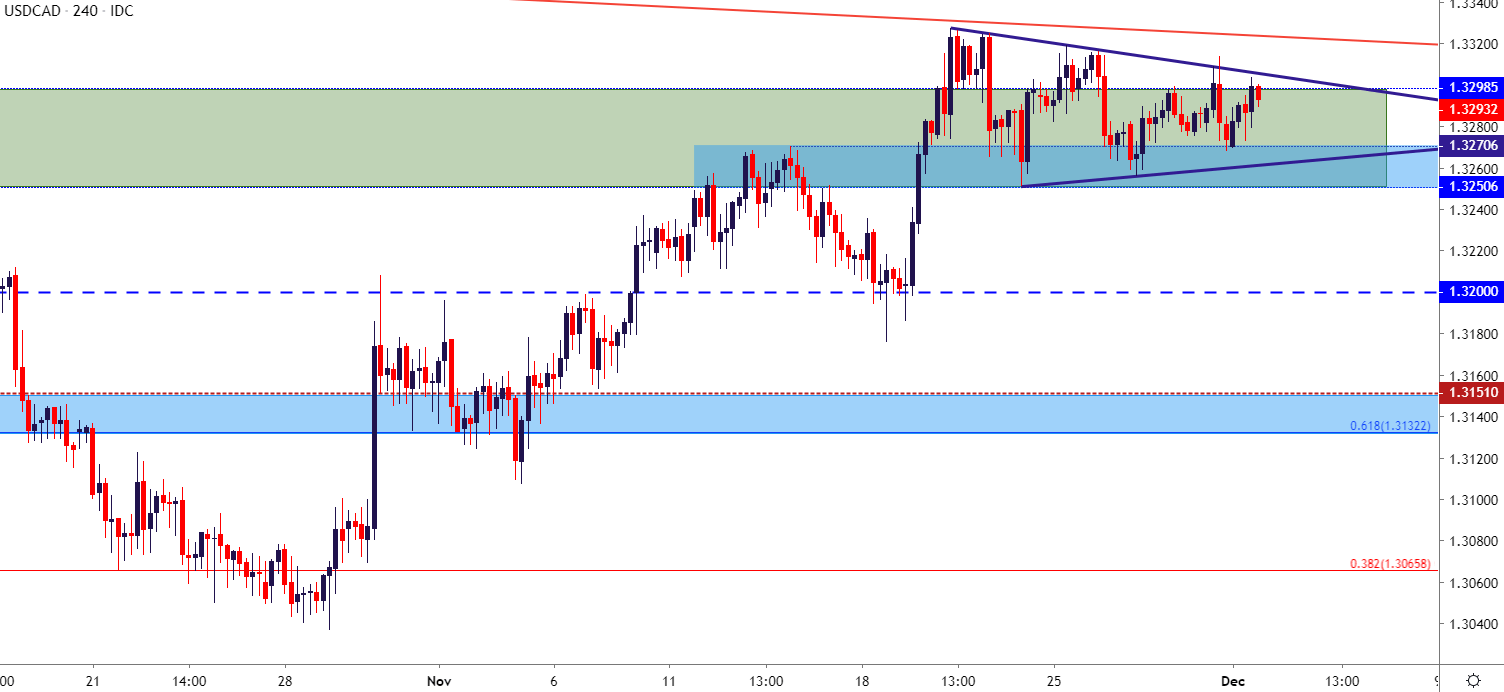
Chart prepared by James Stanley; USDCAD on Tradingview
To read more:
Are you looking for longer-term analysis on the U.S. Dollar? Our DailyFX Forecasts have a section for each major currency, and we also offer a plethora of resources on Gold or USD-pairs such as EUR/USD, GBP/USD, USD/JPY, AUD/USD. Traders can also stay up with near-term positioning via our IG Client Sentiment Indicator.
Forex Trading Resources
DailyFX offers an abundance of tools, indicators and resources to help traders. For those looking for trading ideas, our IG Client Sentiment shows the positioning of retail traders with actual live trades and positions. Our trading guides bring our DailyFX Quarterly Forecasts and our Top Trading Opportunities; and our real-time news feed has intra-day interactions from the DailyFX team. And if you’re looking for real-time analysis, our DailyFX Webinars offer numerous sessions each week in which you can see how and why we’re looking at what we’re looking at.
If you’re looking for educational information, our New to FX guide is there to help new(er) traders while our Traits of Successful Traders research is built to help sharpen the skill set by focusing on risk and trade management.
--- Written by James Stanley, Strategist for DailyFX.com
Contact and follow James on Twitter: @JStanleyFX


