


US Dollar, EURUSD Talking Points:
- The US Dollar dropped down to a fresh weekly low yesterday, with price action finding support at a key level on the chart of 96.47, which is the 23.6% Fibonacci retracement of the 2011-2017 major move. This is a price that’s been back in-play in the Greenback over the past six months; and the big question from here is whether USD bears can continue to push down to fresh lows. On the driver-side of the matter, today at 2PM ET brings FOMC meeting minutes from the January rate decision, which is when the Dollar sparked a topside run that lasted all the way into last week.
- With the US Dollar softening its bullish ascent, a number of related themes have become of interest: USDJPY bulls continue to drive, highlighting an even weaker Yen and making the pair as an option for USD bulls. EURUSD buyers have held range support to go along with a reversal backdrop in USDCHF, setting the table for setups of interest for USD-bears.
- DailyFX Forecasts are published on a variety of currencies such as the US Dollar or the Euro and are available from the DailyFX Trading Guides page. If you’re looking to improve your trading approach, check out Traits of Successful Traders. And if you’re looking for an introductory primer to the Forex market, check out our New to FX Guide.
Do you want to see how retail traders are currently trading the US Dollar? Check out our IG Client Sentiment Indicator.
US Dollar Re-Tests Fibonacci Support
The US Dollar pullback continues into mid-week as the US currency has re-engaged with support at a key Fibonacci level. The price of 96.47 is the 23.6% Fibonacci retracement of the 2011-2017 major move in DXY, and this is a level that’s been in-play numerous times over the past six months. The Dollar dropped yesterday on the heels of some comments from FOMC member, Loretta Mester. Ms. Mester opined that balance sheet reduction could be slowed this year, an indication of potentially even less tightening in monetary policy. This comes in stark contrast to last year’s dual-tightening strategy, in which the bank was both allowing for balance sheet runoff while also hiking rates.
That theme hit fever pitch in Q4, just on the heels of some comments from FOMC Chair, Jerome Powell. When Mr. Powell said that he felt the bank was ‘a long way’ from the neutral rate, markets inferred this to mean that there were many more hikes planned at the US Central Bank. But as risk aversion roared in Q4, the Fed started to slow that hawkish verbiage until, eventually, the bank was ready to put rate hikes on hold in 2019.
This theme comes to light later this afternoon upon the release of FOMC meeting minutes from the January rate decision. The US Dollar embarked on a stern topside run after that meeting, rallying all the way into last week, at which point a range began to build near 2019 highs. Yesterday brought a notable backing-down of the bulls after Ms. Mester’s comments made their way through markets, and prices have since begun to dig-in to support at that 96.47-handle. The next area of interest on the support side of the matter is 96.04, as this is the 50% marker of the 2017-2018 bearish run in USD.
US Dollar Two-Hour Price Chart
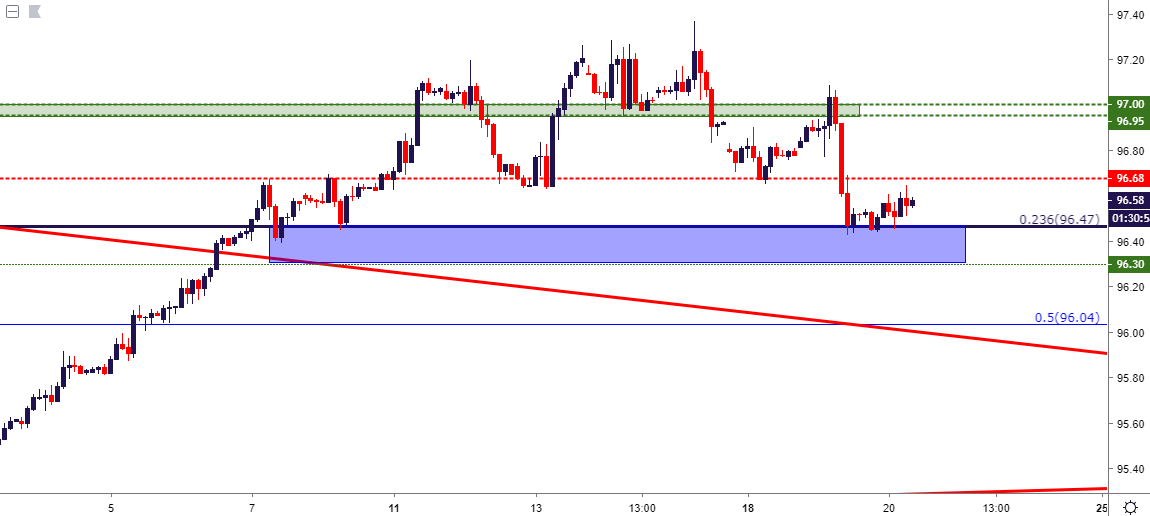
Chart prepared by James Stanley
EURUSD Holds Support Zone
On the final trading day of January, a flicker of hope showed in the Euro. Prices in EURUSD temporarily tested above the 1.1500 psychological level, which marks the topside of a resistance zone that’s now been in-play for more than three months. While a litany of themes and drivers have shown over this period, EURUSD has remained in a range formation. Support has continued to show from 1.1215-1.1300 with resistance holding from 1.1448-1.1500. But as the page turned into February, and as USD bulls began to make their mark after the January FOMC rate decision, a smooth short-term trend drove EURUSD right back down to support.
Since then, prices in the pair have showed evidence of trying to bottom, with a bit of an assist from the 1.1250 level; followed by a move back above the 1.1300 handle. The big question is whether this can hold, and whether the longer-term range continues; or, perhaps, will bears be aggressive enough to finally re-engage with the 1.1215 November swing-low?
EURUSD Eight-Hour Price Chart
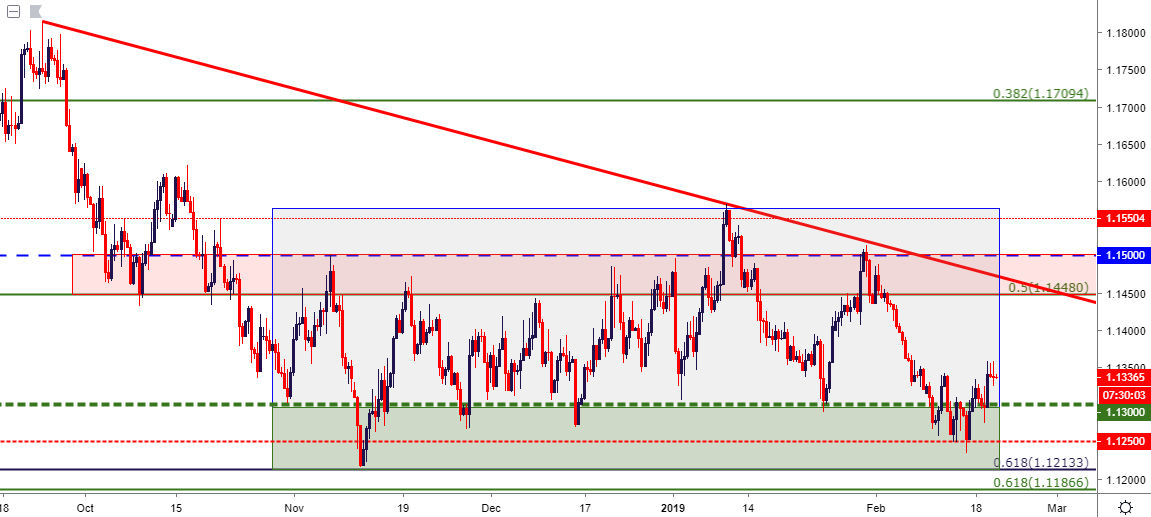
Chart prepared by James Stanley
USDCHF Tests Below Parity
On similar theme, USD strength has continued to pullback in USDCHF, as the pair has begun to re-test the parity level following last week’s topside burst. That bullish breakout from last week ran into resistance from a Fibonacci level at 1.0096. Since, sellers have been able to hold the highs while making a push-lower on the charts. The big question at this point is whether they can continue driving below 1.0000, and the .9902 level lurks below after two separate support tests in the final trading days of January.
USDCHF Four-Hour Price Chart

Chart prepared by James Stanley
USDJPY Bulls Remain In-Control Even with USD Pullback
On the bullish side of the US Dollar, USDJPY remains of interest as the pair has continued to show bullish tendencies, even with this week’s pullback in the US currency. This is indication of an even weaker Yen, coming in stark contrast to the surge of strength that the currency exhibited to start this year. Last week saw USDJPY breakout from the 110.00 level, and buyers retained control all the way up to the 111.00 handle, at which point strength began to slow.
Last week saw prices pull back to 110.30 in USDJPY, and buyers have pushed right back up to the 110.86 Fibonacci level. But for longer-term themes, there may be a more enticing area of support potential around that prior zone of resistance, running from 109.67-110.00.
USDJPY Four-Hour Price Chart
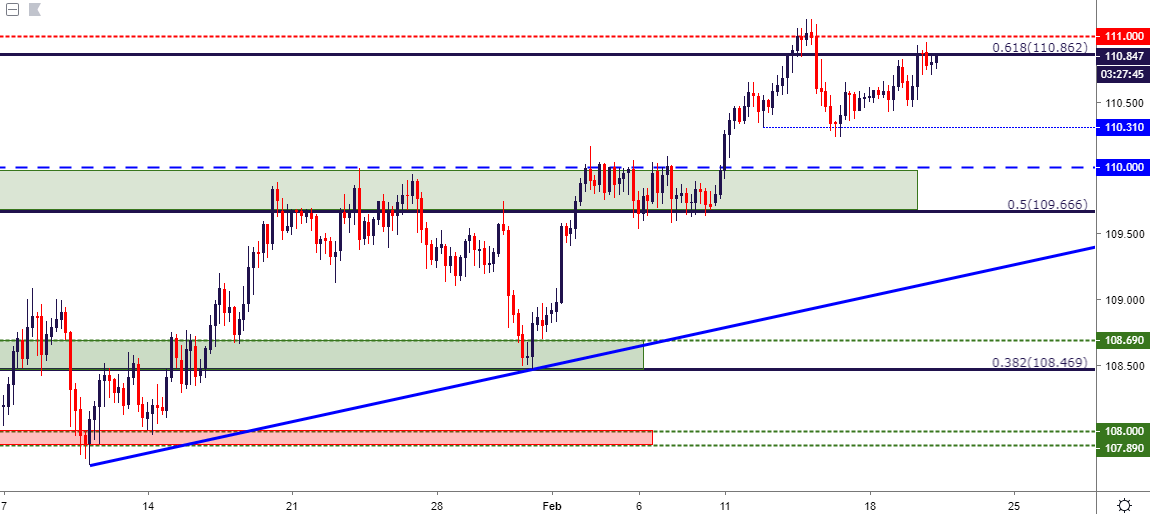
Chart prepared by James Stanley
To read more:
Are you looking for longer-term analysis on the U.S. Dollar? Our DailyFX Forecasts have a section for each major currency, and we also offer a plethora of resources on USD-pairs such as EUR/USD, GBP/USD, USD/JPY, AUD/USD. Traders can also stay up with near-term positioning via our IG Client Sentiment Indicator.
Forex Trading Resources
DailyFX offers a plethora of tools, indicators and resources to help traders. For those looking for trading ideas, our IG Client Sentiment shows the positioning of retail traders with actual live trades and positions. Our trading guides bring our DailyFX Quarterly Forecasts and our Top Trading Opportunities; and our real-time news feed has intra-day interactions from the DailyFX team. And if you’re looking for real-time analysis, our DailyFX Webinars offer numerous sessions each week in which you can see how and why we’re looking at what we’re looking at.
If you’re looking for educational information, our New to FX guide is there to help new(er) traders while our Traits of Successful Traders research is built to help sharpen the skill set by focusing on risk and trade management.
--- Written by James Stanley, Strategist for DailyFX.com
Contact and follow James on Twitter: @JStanleyFX


