


FOMC Analysis and USD Price and Chart:
The Q1 2019 US Dollar Forecast is available to download for free along with the outlook for a range of other currencies and assets.
The minutes of the January FOMC policy meeting are expected to highlight the recent pivot from tighter monetary policy as Fed concerns over slowing US and global growth increase. January’s meeting saw the expected path of interest rate hikes in 2019 – two 0.25% hikes were roundly expected – taken off the table while the Fed also suggested that ongoing balance sheet reduction is very much part of their discussions going forward. This pause in monetary tightening leaves the Fed able to hone in on data, especially inflation, and take into consideration the weakness in growth currently evident across the globe. The minutes may show that the balance sheet reduction program may be tapered in the coming months and paused by the end of the year, especially if inflation fails to pick-up.
Using News and Events to Trade Forex.
The dovish-pivot in the FOMC meeting at the end of January did little to prevent the US dollar powering ahead against a range of currencies, catching the market out. The US dollar garnered buyers based on USD being ‘the best of a bad bunch’ as the Euro fell on ongoing growth concerns, while Sterling remains blighted by Brexit.
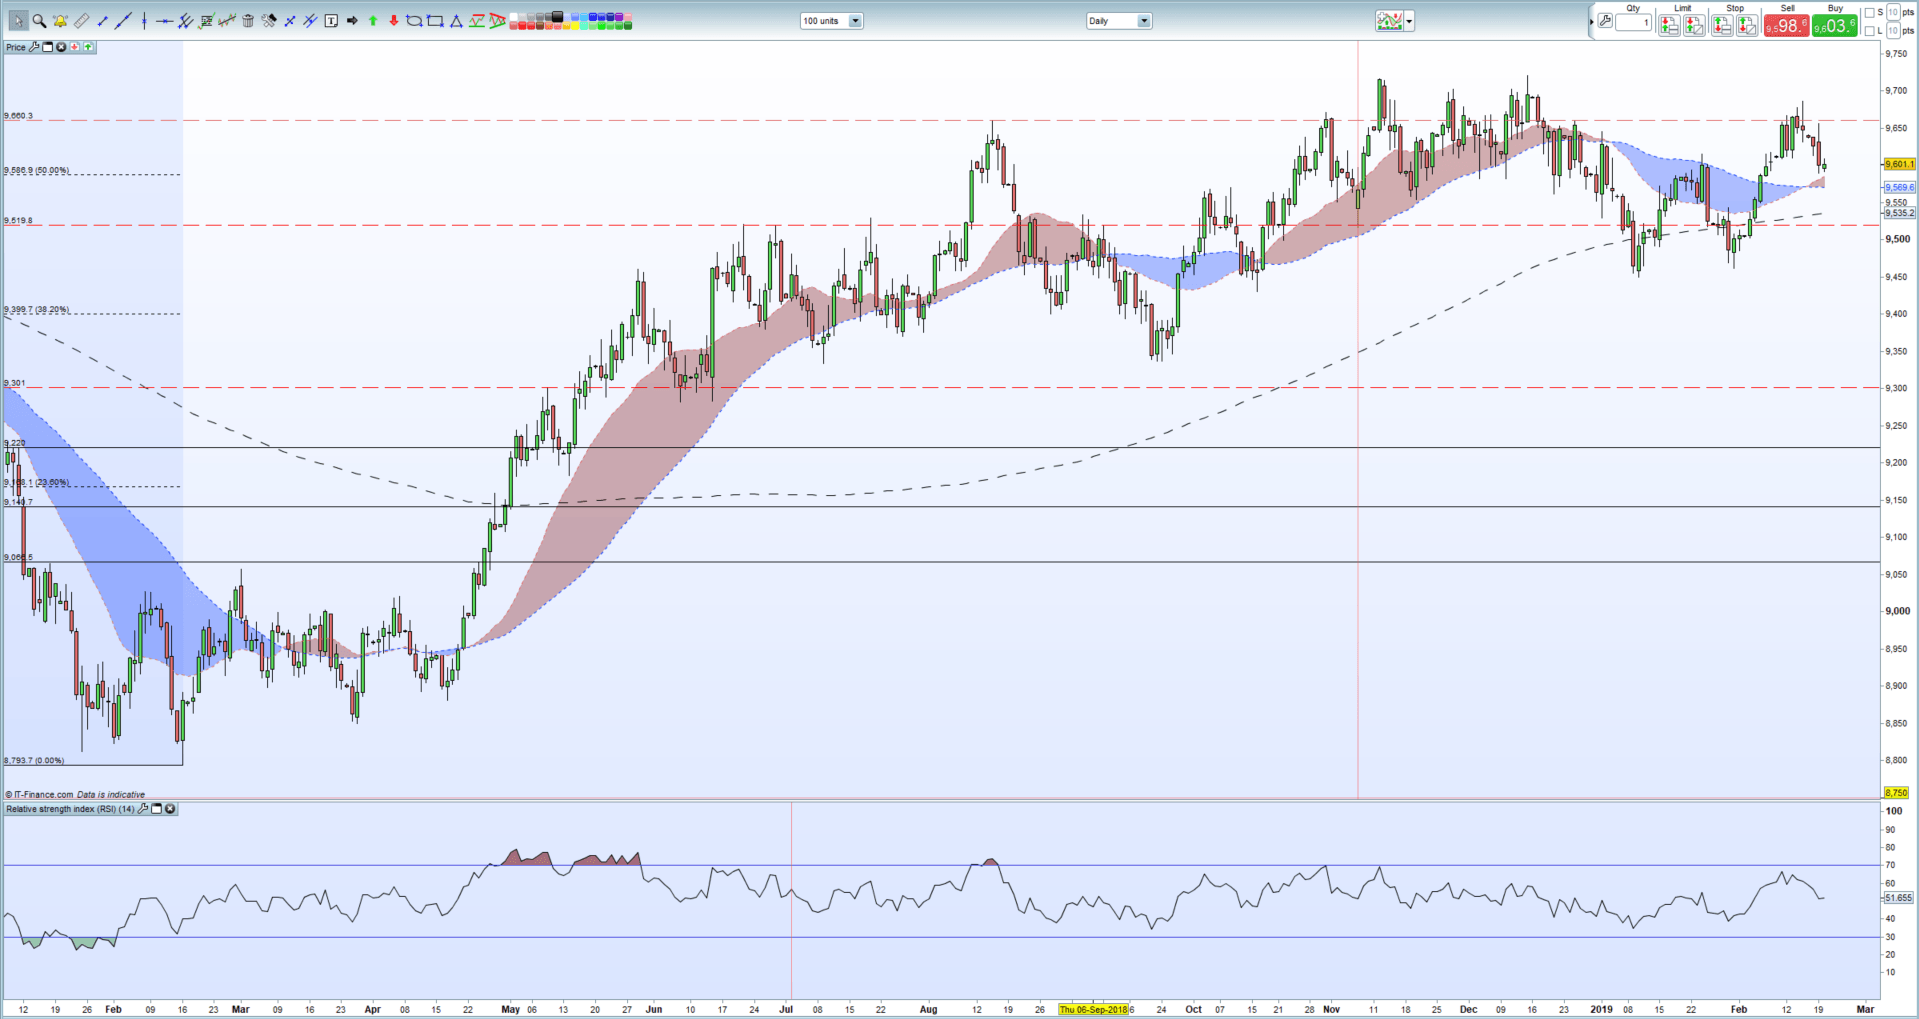
The US dollar basket (DXY) touched a two-month high of 96.86 on February 15 before sellers took control, pushing DXY back down to a current level of 96.00. The yield on the benchmark 10-year US Treasury has also drifted to a six-week low of 2.625%, adding further downward pressure on the greenback. The US dollar basket chart remains positive as it stands, but a cluster of support levels between 95.87 (50% Fibonacci) and the three moving averages between 95.85 and 95.35 may come pressure in the near-term. The great US dollar rally of the last year may well be coming to an end.
IG Client Sentiment data shows how retail traders are currently positioned, and what it means, in a variety of currencies and assets.
USD Daily Price Chart (January 2018 – February 20, 2019)
Traders may be interested in two of our trading guides – Traits of Successful Traders and Top Trading Lessons – while technical analysts are likely to be interested in our latest Elliott Wave Guide.
What is your view on the US dollar – bullish or bearish?? You can let us know via the form at the end of this piece or you can contact the author at nicholas.cawley@ig.com or via Twitter @nickcawley1.


