


EURUSD, US Dollar Talking Points:
- The US Dollar continues to trade near 2019 highs after last week saw a short-term range build atop the move. Support has continued to show around the prior resistance value of 96.68, and that price held another support check shortly after the open of this week. The big question around the Greenback is whether bulls can continue to push as resistance has built-in around the 97.30-97.38 area on the charts. On the driver-side of the matter, tomorrow brings FOMC meeting minutes and Thursday brings US Durable Goods.
- On a longer-term basis, the EURUSD range continues to hold around three-month lows. Is this the week the bears finally breakaway to a fresh low? Or will the three-month range continue to hold? On the bullish side of the US Dollar, USDJPY remains of interest as prices have continued with the topside trend after buyers pushed up to a fresh 2019 high last week. A rather shallow pullback developed with support showing at 110.30.
- DailyFX Forecasts are published on a variety of currencies such as the US Dollar or the Euro and are available from the DailyFX Trading Guides page. If you’re looking to improve your trading approach, check out Traits of Successful Traders. And if you’re looking for an introductory primer to the Forex market, check out our New to FX Guide.
Do you want to see how retail traders are currently trading the US Dollar? Check out our IG Client Sentiment Indicator.
US Dollar Bounces From Support, Can Buyers Push Through Resistance?
The US Dollar has spent the past week building into a range around two-month highs. Support has set-in around the 96.68 level which had previously functioned as resistance; and the top-end of the range has shown between 97.30-97.38. After a small gap-lower to open this week, prices re-checked off of 96.68 yesterday to bounce back-above for another test of the 97.00-level.
The big question for this week around the US Dollar is whether bulls can push up to a fresh high. The post-FOMC move in the Greenback has continued to drive through the month of February and as yet, buyers have shown no signs of letting up. As discussed on Friday, this week’s economic calendar is rather light: Wednesday brings FOMC meeting minutes from the January rate decision and Thursday brings Durable Goods numbers out of the US. Outside of this, USD volatility may come from some of the Fed-speak on the calendar, with Loretta Mester speaking this morning, James Bullard on Wednesday and Friday and Mr. Rafael Bostic speaking on Thursday.
US Dollar Hourly Price Chart

Chart prepared by James Stanley
EURUSD Hovers in Support Zone
Going along with last week’s build of a range in the US Dollar has been a similar observation in EUR/USD, as the pair continues to hold the support side of a zone that’s been in-play for the past three months-plus. I had looked at this as part of this week’s FX Setups, as the prospect of range continuation can keep the topside of the scenario of interest, at least until sellers are able to take out the lows.
EURUSD Eight-Hour Price Chart
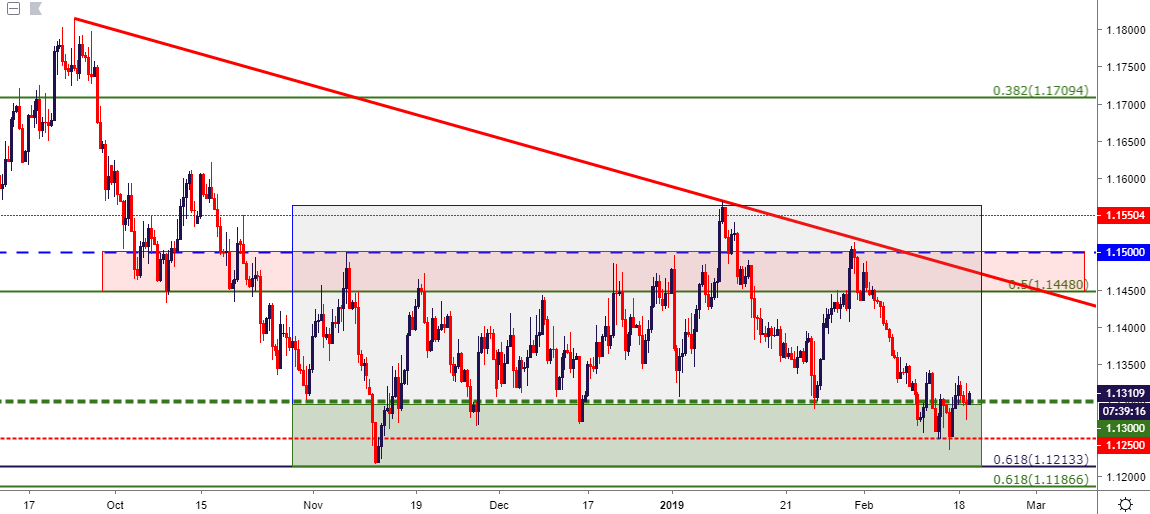
Chart prepared by James Stanley
GBPUSD Makes Push Towards 1.3000
The bounce in the British Pound is continuing into a fresh week, as last week’s sell-off to test below the 1.2800-handle has seen a return of buyers. Last week’s swing-high at 1.2959 has already been tested, and this opens the door for a deeper resistance test of the zone that runs from 1.3000 up to the 1.3034 Fibonacci level.
GBPUSD Four-Hour Price Chart
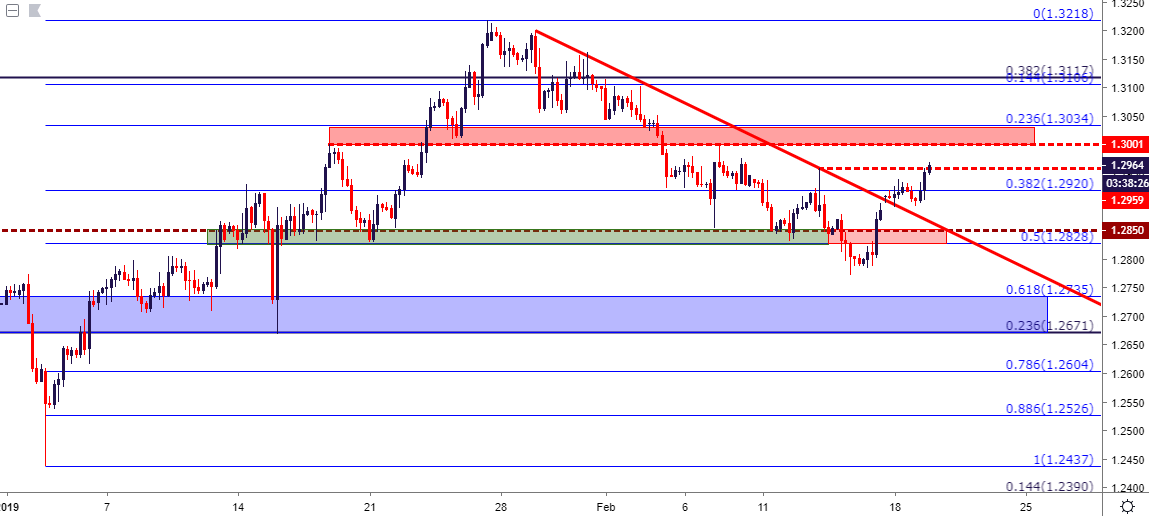
Chart prepared by James Stanley
USDCAD Bearish Potential After Trend-Line Hold
Price action in USDCAD continues to narrow after the early-February ramp. That move previously found resistance at the 1.3325 level, which helped to cauterize the highs last week despite a quick wick testing above that price. Follow-through price action saw resistance hold on a bearish trend-line projection, and this can keep the door open for bearish themes in the pair. At this stage, support appears to be holding from the 1.3236-1.3259 area, which has been back in-play for much of 2019 price action in the pair. If sellers are able to hold the line of resistance, a deeper support test in the 1.3132 or 1.3065 areas could be an item of interest for this week.
USDCAD Four-Hour Price Chart
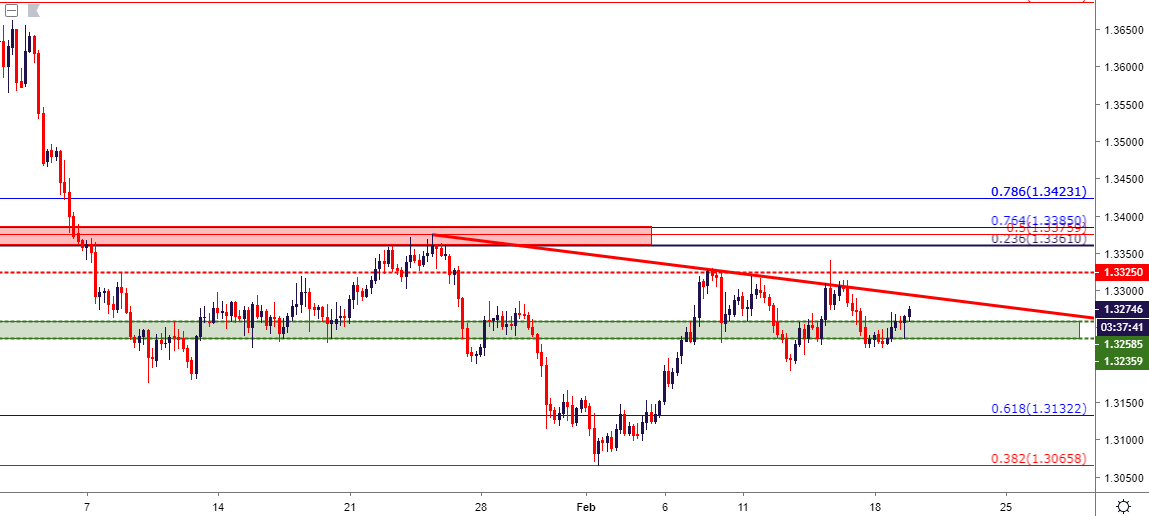
Chart prepared by James Stanley
USDJPY Works Back-Towards 111.00
On the bullish side of the US Dollar, USDJPY continues to hold interest. The pair started the year with a massive drop as the Yen experienced a significant surge of strength. Since then, however, prices have been clawing back prior losses in the pair and last week saw USDJPY re-test the 111.00 level for the first time in the New Year. After buyers proved unable to continue the move significantly above 111.00, prices posed a pullback with support showing at the 110.30 level; and since then another topside push has developed. The big question here is whether that pullback was enough to bring on fresh highs; or whether a deeper retracement may develop. On the support side of the pair, the area from 109.67-110.00 remains of interest, as this zone offered almost a full month of resistance before last week’s bullish breakout in the pair.
USDJPY Four-Hour Price Chart
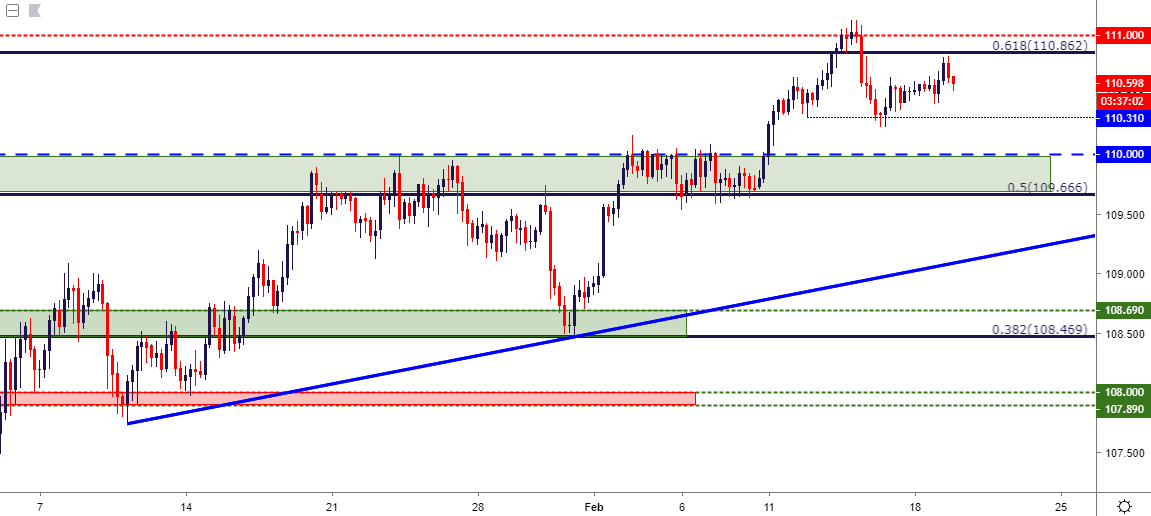
Chart prepared by James Stanley
To read more:
Are you looking for longer-term analysis on the U.S. Dollar? Our DailyFX Forecasts for Q1 have a section for each major currency, and we also offer a plethora of resources on USD-pairs such as EUR/USD, GBP/USD, USD/JPY, AUD/USD. Traders can also stay up with near-term positioning via our IG Client Sentiment Indicator.
Forex Trading Resources
DailyFX offers a plethora of tools, indicators and resources to help traders. For those looking for trading ideas, our IG Client Sentiment shows the positioning of retail traders with actual live trades and positions. Our trading guides bring our DailyFX Quarterly Forecasts and our Top Trading Opportunities; and our real-time news feed has intra-day interactions from the DailyFX team. And if you’re looking for real-time analysis, our DailyFX Webinars offer numerous sessions each week in which you can see how and why we’re looking at what we’re looking at.
If you’re looking for educational information, our New to FX guide is there to help new(er) traders while our Traits of Successful Traders research is built to help sharpen the skill set by focusing on risk and trade management.
--- Written by James Stanley, Strategist for DailyFX.com
Contact and follow James on Twitter: @JStanleyFX


