


EUR/USD, US Dollar Talking Points:
- US CPI came out in-line with expectations this morning, printing right at the 2.2% expectation for both headline and core CPI reads. While this remains above the Fed’s 2% inflation target, headline inflation remains well-below the 2.9% reads from June and July of this year and the 2.5% that printed last month. Tomorrow’s economic calendar brings the final ECB rate decision for 2018 to the table.
- EUR/USD has pushed higher after running into support yesterday, as taken from a upward-sloping trend-line that makes up the support side of a symmetrical triangle that’s been building over the past month. This continues the congestion in the pair as price action has continued to compress inside of both longer-term support and resistance areas. In GBP/USD, the pair is rallying after running into the 1.2500 level earlier this week, with the no-confidence vote for Theresa May set to take place later today.
- DailyFX Forecasts on a variety of currencies such as the US Dollar or the Euro are available from the DailyFX Trading Guides page. If you’re looking to improve your trading approach, check out Traits of Successful Traders. And if you’re looking for an introductory primer to the Forex market, check out our New to FX Guide.
Do you want to see how retail traders are currently trading the US Dollar? Check out our IG Client Sentiment Indicator.
US Dollar Runs into Resistance, Can USD Bulls Continue to Push?
It’s been a busy week already around the US Dollar, as the currency came into this week’s trade with a continuation of last week’s selling. Support soon showed around a key Fibonacci level at 96.47, and Dollar bulls came back to re-take control of the matter; in short order prices were back-up to near-term resistance. This was the same support level that helped to hold the lows last week. Yesterday saw this resistance hold around the late-November swing-high, and with an assist from a bearish trend-line, buyers were stopped in their tracks.
USD Two-Hour Price Chart
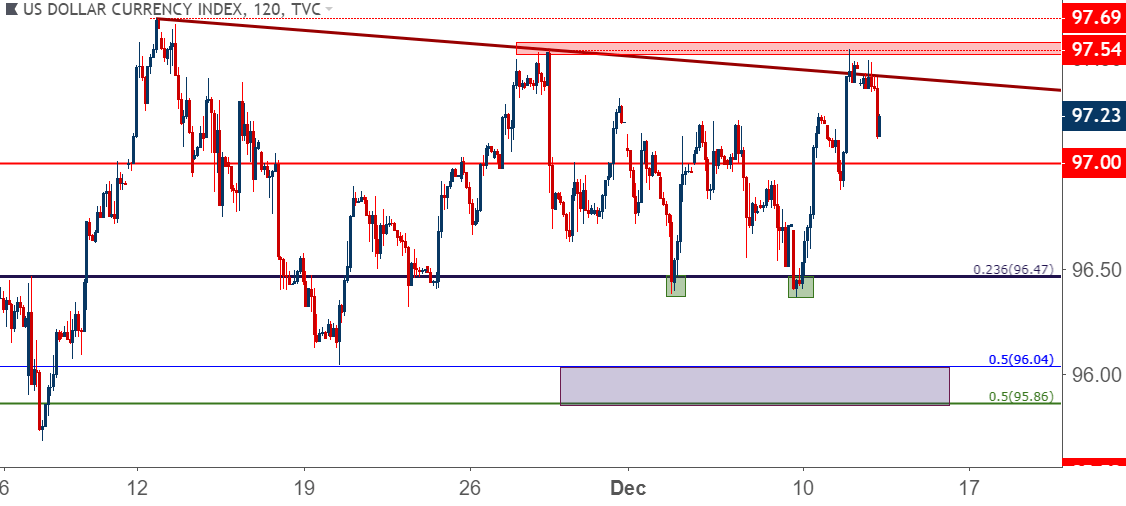
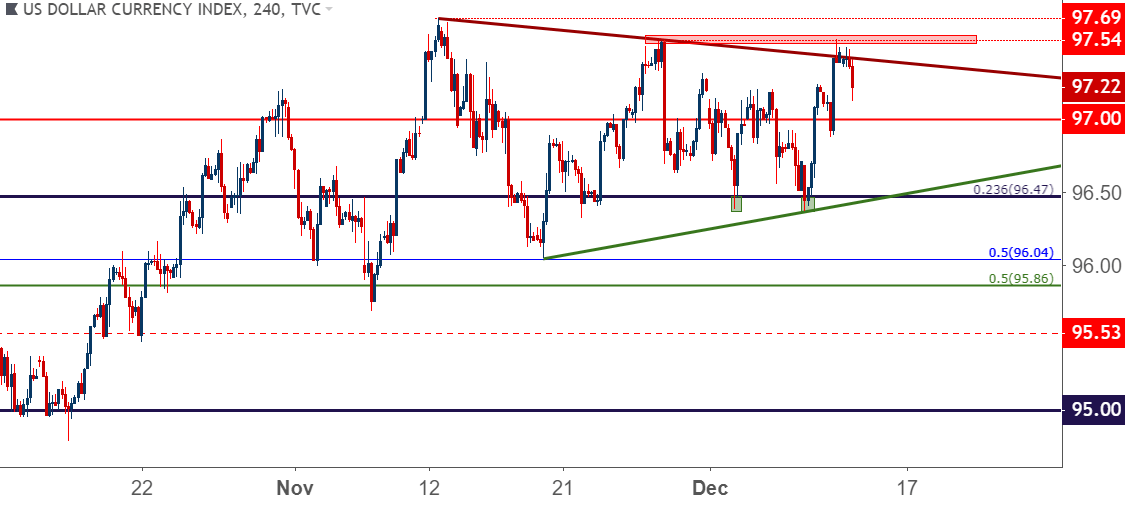
The big question around the Dollar at this point is whether bulls come back to re-test the yearly high at 97.69, or whether a deeper pullback might be sitting in front of us after this resistance zone came into play. As looked at over the past couple of days, there’s potential on either side of the equation as USD has been in a range-like state over the past month, seeing both higher-lows to go along with lower-highs.
US Dollar Four-Hour Price Chart
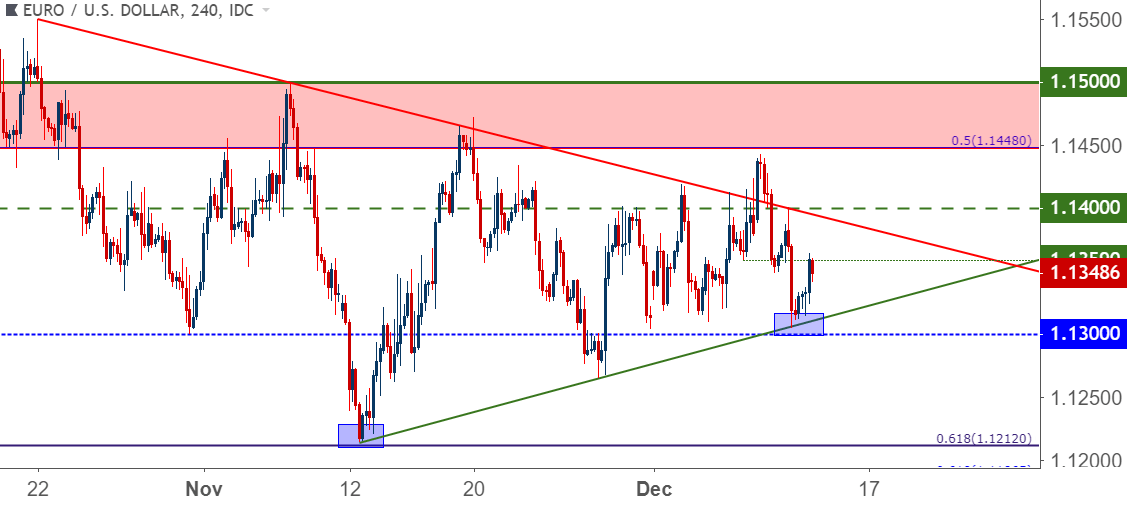
EUR/USD Bounces From Trend-Line Support
Similar to the US Dollar, EUR/USD has been lacking longer-term trends over the past month as prices have exhibited back-and-forth action. In EUR/USD, that price action has been shown as compression with prices trading deeper into a symmetrical triangle formation. The topside of that formation was tested as USD-weakness remained around the open of this week; but the support side of the triangle soon came into play to help hold the lows until buyers could come back into the equation. Yesterday saw a test of the trend-line making up the support side of that triangle, and thus far that level is helping to hold support.
EUR/USD Four-Hour Price Chart
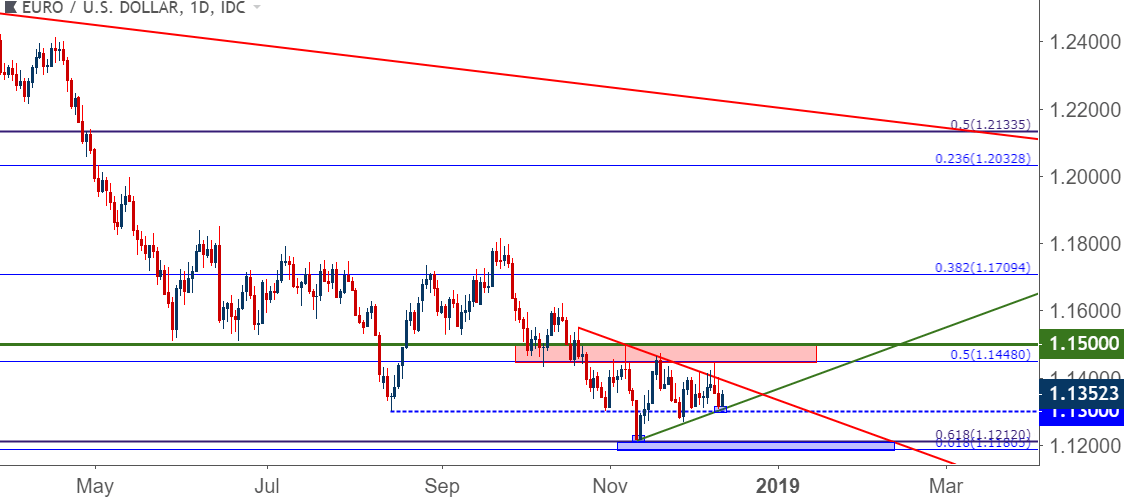
Taking a step back, EUR/USD is caught between longer-term support and resistance on either side of that wedge. The level of 1.1212 is the 61.8% retracement of the 2000-2008 major move in the pair, and this level played a role in the two-plus year range in EUR/USD that started back in 2015. This price was nearly in-play a month ago, when a steep drop in the pair saw sellers pull up just shy of a re-test of that level, missing by a mere two pips. On the resistance side of the coin, the zone that I’ve been following for the past few months remains relevant, and this runs from 1.1448-1.1500, with the former level serving as the 50% marker from last year’s bullish move in the pair. This zone helped to hold the lows in early-October but has since become resistance.
Traders looking to make longer-term directional plays on the pair can look for either zone to first give way as a signal that the congestion is giving way to potential new trends.
EUR/USD Daily Price Chart: Bound Between Big Levels
GBP/USD Rallies as Theresa May Faces No-Confidence Vote
Well, it finally happened. The 1922 committee received the required 48 letters from at least 15% of MP’s, and Theresa May is facing a vote of no-confidence. This comes on the heels of PM May cancelling a vote in Parliament on the Brexit plan, and this has made an already messy situation even more opaque and unpredictable.
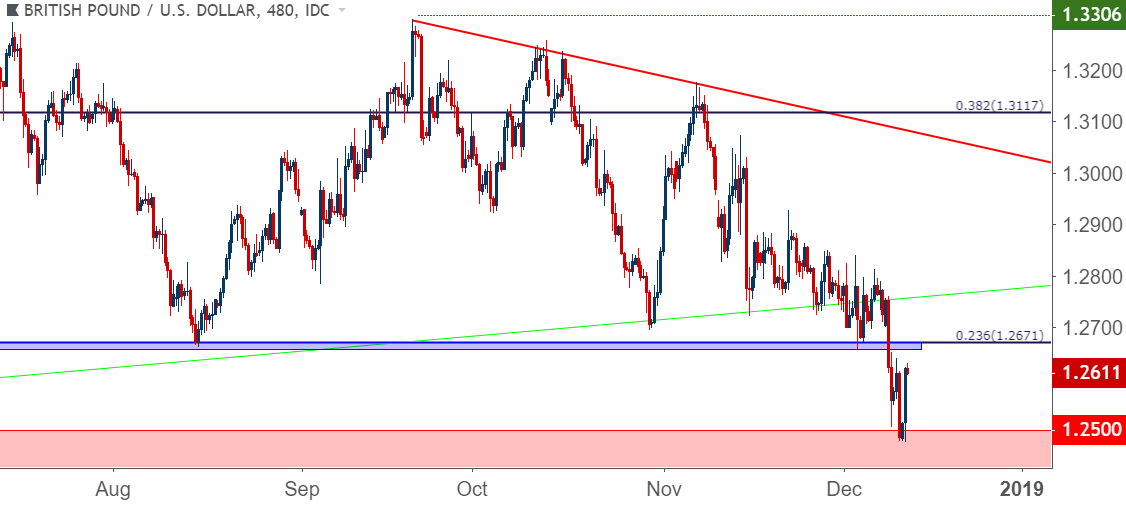
GBP/USD has shown a tendency to sell-off around uncertainty since the Brexit referendum, and the earlier-week news was no different, as this brought a breakdown in GBP/USD to fresh 18-month lows; with the pair finding a bit of support off of the 1.2500 psychological level. That support has thus far held and prices are rallying back to 1.2600.
GBP/USD Eight-Hour Price Chart
Tonight’s Vote
The no-confidence vote is expected to take place between 6-8 PM in London (1-3 PM ET); and if PM May wins, she gets a year of safety per the rules of 1922. This could further push short-term strength in GBP/USD, and the 1.2671 level that had previously set the yearly low remains as potential resistance.
If she loses, however, she must step down, and this will inject even more uncertainty into an already difficult situation. This will likely spell more down-side for GBP/USD with that 1.2500 level coming back into play, and below that level is another potential support around 1.2390.
GBP/USD Weekly Price Chart
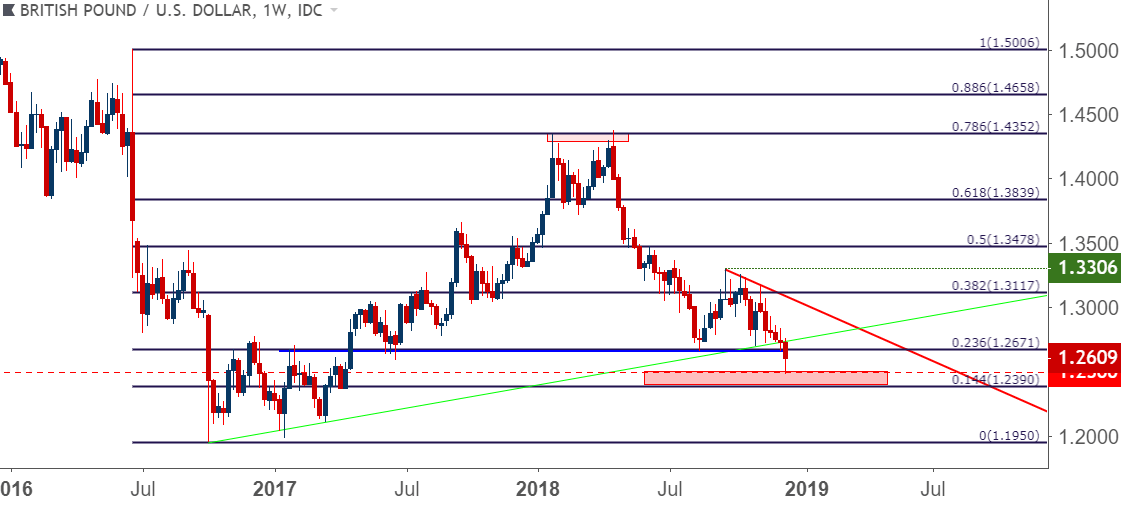
Chart prepared by James Stanley
To read more:
Are you looking for longer-term analysis on the U.S. Dollar? Our DailyFX Forecasts for Q4 have a section for each major currency, and we also offer a plethora of resources on USD-pairs such as EUR/USD, GBP/USD, USD/JPY, AUD/USD. Traders can also stay up with near-term positioning via our IG Client Sentiment Indicator.
Forex Trading Resources
DailyFX offers a plethora of tools, indicators and resources to help traders. For those looking for trading ideas, our IG Client Sentiment shows the positioning of retail traders with actual live trades and positions. Our trading guides bring our DailyFX Quarterly Forecasts and our Top Trading Opportunities; and our real-time news feed has intra-day interactions from the DailyFX team. And if you’re looking for real-time analysis, our DailyFX Webinars offer numerous sessions each week in which you can see how and why we’re looking at what we’re looking at.
If you’re looking for educational information, our New to FX guide is there to help new(er) traders while our Traits of Successful Traders research is built to help sharpen the skill set by focusing on risk and trade management.
--- Written by James Stanley, Strategist for DailyFX.com
Contact and follow James on Twitter: @JStanleyFX


