


US Dollar Talking Points:
- The US Dollar is starting this week by attempting to recover losses from last week. Last week saw a gap in the US Dollar on the open that soon became resistance, with sellers taking over in the latter portion of the period until the 96.47 Fibonacci level came back into play. This is the 23.6% Fibonacci retracement of the 2011-2017 major move in the US Dollar. That level has helped to hold support so far for today, and the big question is whether buyers come back to resume the prior bullish trend or whether a deeper pullback or sell-off is on the horizon.
- EUR/USD is showing early signs of trying to break the pair’s recent range of congestion. EUR/USD has been building into a symmetrical wedge formation for more than a month now, and a big zone of resistance sits overhead from 1.1448-1.1500.
- DailyFX Forecasts on a variety of currencies such as the US Dollar or the Euro are available from the DailyFX Trading Guides page. If you’re looking to improve your trading approach, check out Traits of Successful Traders. And if you’re looking for an introductory primer to the Forex market, check out our New to FX Guide.
Do you want to see how retail traders are currently trading the US Dollar? Check out our IG Client Sentiment Indicator.
US Dollar Bounce From Fibonacci Support
The US Dollar is bouncing from a key area of Fibonacci support to open this week, and this takes place after a rough outing last week for USD bulls. After the Greenback filled last weekend’s gap, finding resistance at the prior close on three separate occasions, sellers took over to push prices down to 96.40. But, similar to what was seen last week, bearish pressure slowed, and prices began to bounce using the 96.47 Fibonacci level for an assist. The big question as we open this week is whether buyers can continue to push, or whether a larger wave of weakness is on the horizon.
US Dollar Two-Hour Price Chart: Resistance at Last Week’s Gap, Support at 96.47 Fibonacci Level
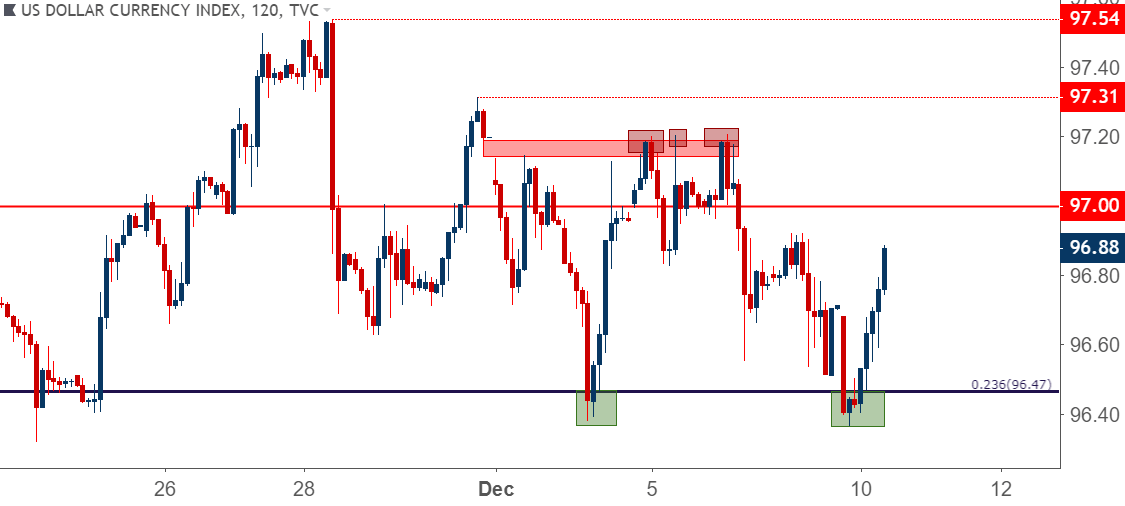
Chart prepared by James Stanley
On a bigger-picture basis, there is a potential for a deeper sell-off or pullback after the US Dollar’s begun to trade below the bullish channel that’s been going since September. Strength showed in the currency after the September rate hike at the FOMC and lasted until we traded into December. Price action posed an initial test below this channel last week, but buyers soon reacted to the 96.47 Fibonacci level to push prices back-up to fill last week’s opening gap. But now that sellers have pushed back below this area, the big question is whether the support coming from that Fibonacci level can last for much longer. A bit deeper is additional support potential around 95.86-96.04.
US Dollar Four-Hour Price Chart
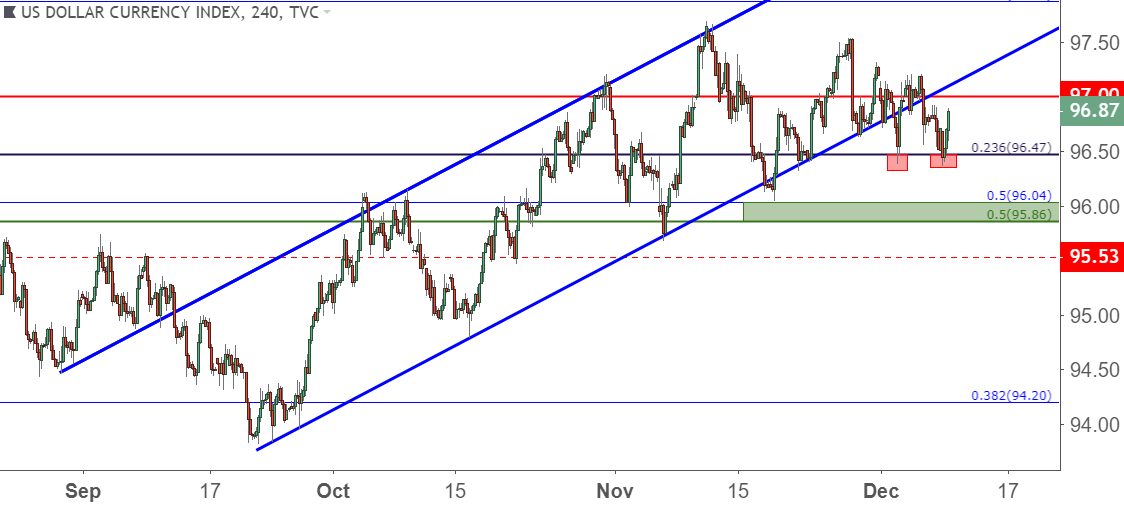
Chart prepared by James Stanley
This Week’s Economic Calendar
On this week’s economic calendar are two items of note out of the US, and that’s the Wednesday release of CPI data for November followed by Advance Retail Sales set to be released on Friday. Outside of the States, Europe is in focus in the latter-portion of the week as the ECB rate decision is on Thursday and Mario Draghi has a speech in Pisa, Italy on Friday.
DailyFX Economic Calendar: High-Impact Events for the Week of December 10, 2018
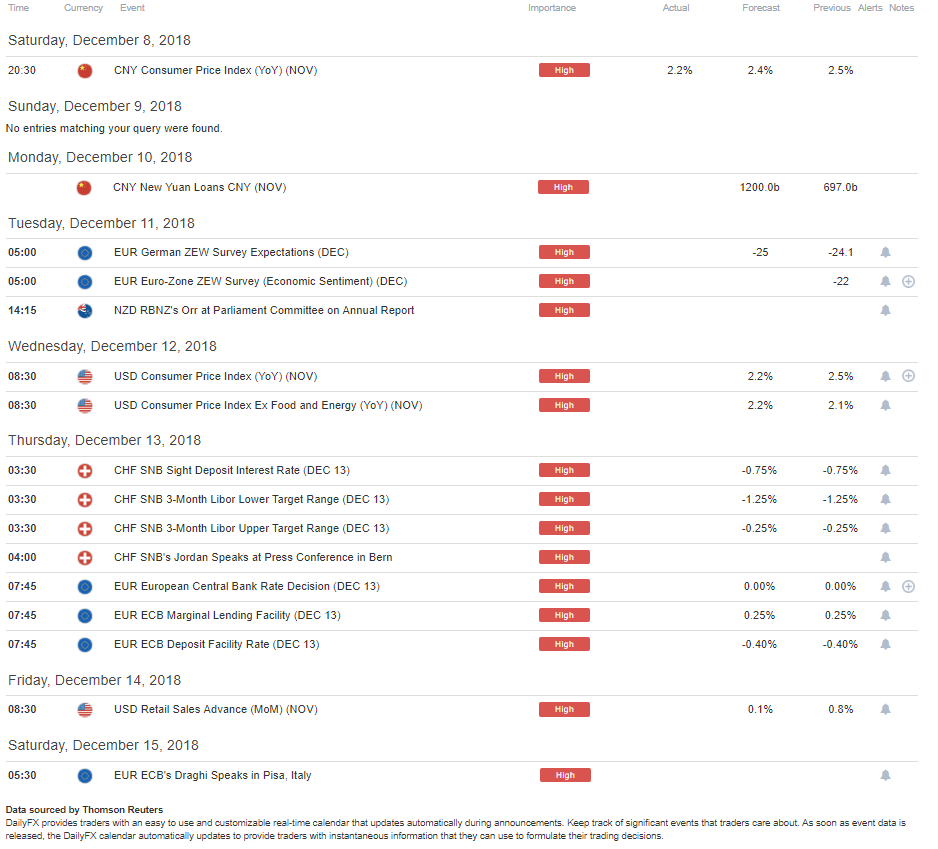
Chart prepared by James Stanley
Euro Attempts to Break Congestion Ahead of ECB
In-front of that ECB meeting later this week, the Euro is attempting to string together gains to break out of a recent range of congestion. On the Daily chart below, that congestion becomes visible as EUR/USD has spent much of the past month trading into a symmetrical wedge pattern, with the past two trading days seeing bulls tip-toe above resistance.
EUR/USD Daily Price Chart
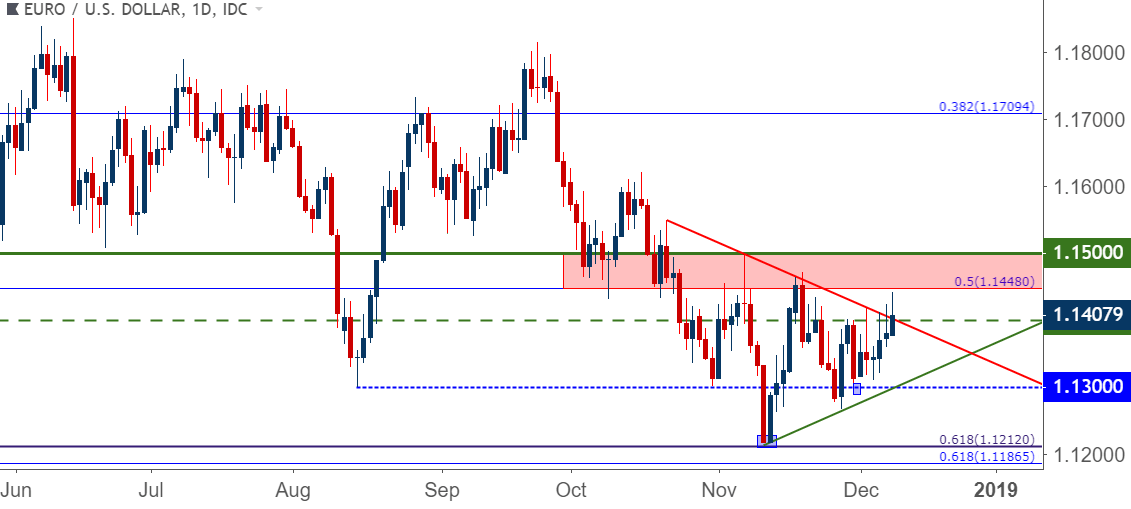
Chart prepared by James Stanley
Going down to a shorter-term chart will show this bullish attempt a bit more clearly, as buyers have pushed up to a fresh two-week-high to start this week, and prices are now pulling back to find a bit of short-term support around prior resistance.
EUR/USD Four-Hour Price Chart
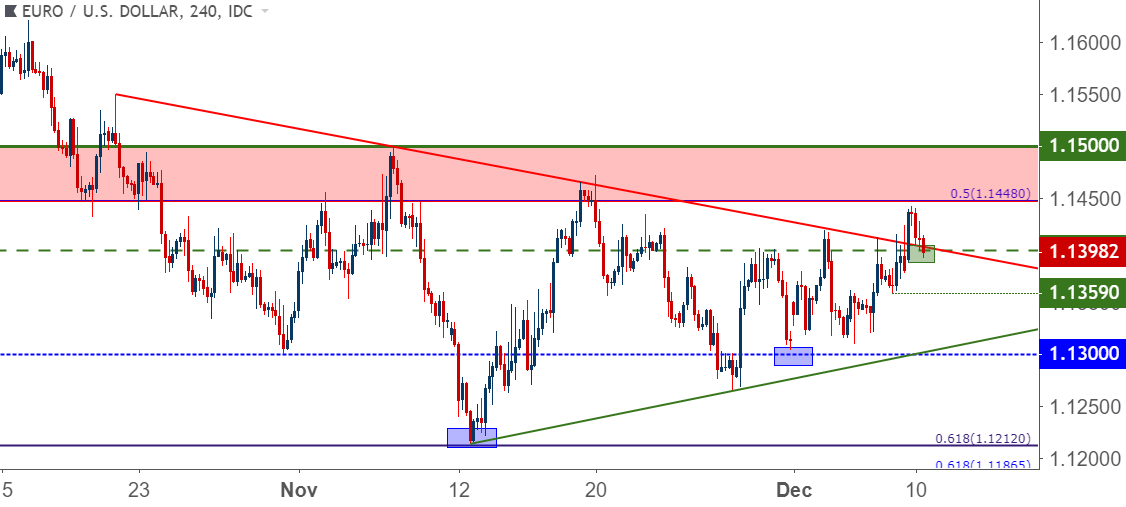
Chart prepared by James Stanley
GBP/USD: Pound Breaks Down on Brexit Vote Cancellation
Another week, another twist in the Brexit saga, and it now looks like the vote for the House of Commons will be delayed. This is not being taken lightly by GBP traders as Cable is now trading down to fresh 18-month lows to open the week, and this is likely playing a part in that support bounce showing in USD to kick off this week’s trade. The big question here is how far bears might push? Could this possibly bring the 1.2500 psychological level into play? Below that level would be one more area of interest, and that’s the 14.4% Fibonacci retracement of the Brexit move at 1.2390, a level that was last in play in April of 2017.
Given the early nature of this move, traders would likely want to remain cautious of chasing the move to start the week.
GBP/USD Weekly Price Chart
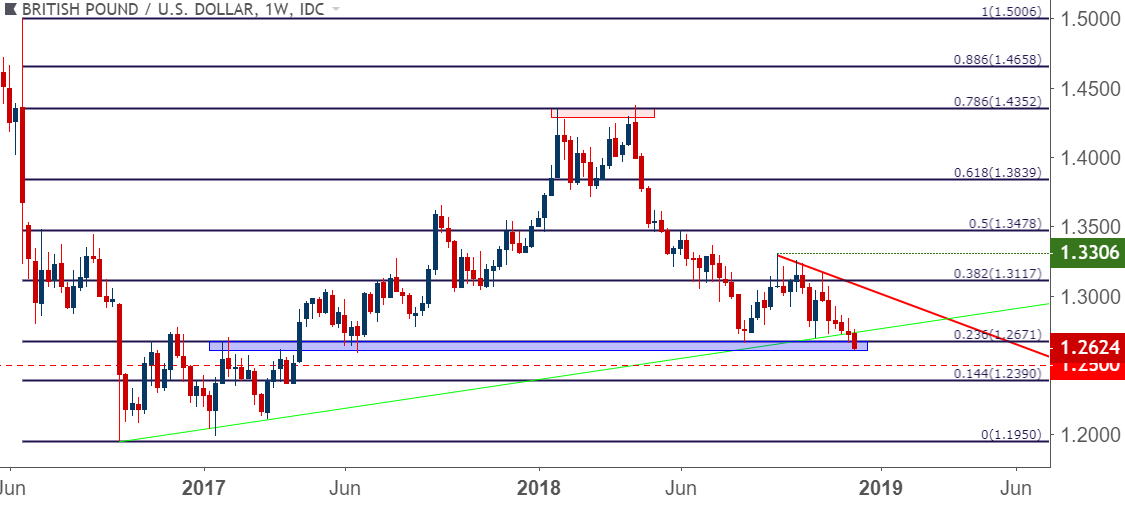
Chart prepared by James Stanley
To read more:
Are you looking for longer-term analysis on the U.S. Dollar? Our DailyFX Forecasts for Q4 have a section for each major currency, and we also offer a plethora of resources on USD-pairs such as EUR/USD, GBP/USD, USD/JPY, AUD/USD. Traders can also stay up with near-term positioning via our IG Client Sentiment Indicator.
Forex Trading Resources
DailyFX offers a plethora of tools, indicators and resources to help traders. For those looking for trading ideas, our IG Client Sentiment shows the positioning of retail traders with actual live trades and positions. Our trading guides bring our DailyFX Quarterly Forecasts and our Top Trading Opportunities; and our real-time news feed has intra-day interactions from the DailyFX team. And if you’re looking for real-time analysis, our DailyFX Webinars offer numerous sessions each week in which you can see how and why we’re looking at what we’re looking at.
If you’re looking for educational information, our New to FX guide is there to help new(er) traders while our Traits of Successful Traders research is built to help sharpen the skill set by focusing on risk and trade management.
--- Written by James Stanley, Strategist for DailyFX.com
Contact and follow James on Twitter: @JStanleyFX


