


Talking Points:
- This morning’s NFP report was healthy and well-rounded, with the headline of +223k beating the expectation of +190k. The unemployment rate printed at 3.8%, and Average Hourly Earnings came in at 2.7% yoy, beating the expectation of 2.6%. All-in-all, making for a well-rounded outlay in this morning’s US jobs data, and setting up the Fed’s rate decision for a hike at the next FOMC meeting, taking place June 12-13.
- Next week’s economic calendar is rather light. Attention will likely be on the topics of trade wars, tariffs and European politics. This retains the potential for continued risk aversion in Europe, particularly in equity markets. Meanwhile, a flare of Yen-weakness may be re-opening the door to those prior trends, which had pulled back when it appeared that the US-NK summit was called-off.
- DailyFX Forecasts have been updated for Q2, and are available from the DailyFX Trading Guides page. If you’re looking to improve your trading approach, check out Traits of Successful Traders. And if you’re looking for an introductory primer to the Forex market, check out our New to FX Guide.
Do you want to see how retail traders are currently trading the US Dollar? Check out our IG Client Sentiment Indicator.
NFP Beats, US Dollar Tests Resistance
This morning’s NFP report was released to a healthy print of +223,000 for the month of May, and this beat the expectation of +190k while we also saw net revisions of +15,000 for the prior two months. While these aren’t enormous beats of the expectation, they were well supported by the rest of the report as the unemployment rate printed at 3.8% and Average Hourly Earnings came-in at an annualized 2.7%, which bested the expectation and prior month’s print of 2.6%.
The net response was a quick move of USD-strength as DXY put-in another test of the resistance zone that we’ve been following. This area runs from 94.19-94.30 on the charts, and this is comprised of two different 38.2% Fibonacci retracements. This zone provided resistance last week, on Wednesday and Friday; soon becoming support on Monday of this week after prices had launched-higher. A couple of days later, a retracement in the Greenback showed up, and prices slid below this zone; and we now have a show of resistance over the past two days. The big question is whether Dollar bulls will find the motivation to break through in today’s US session.
US Dollar via ‘DXY’ Hourly Chart: Back to Key Zone 94.19-94.30
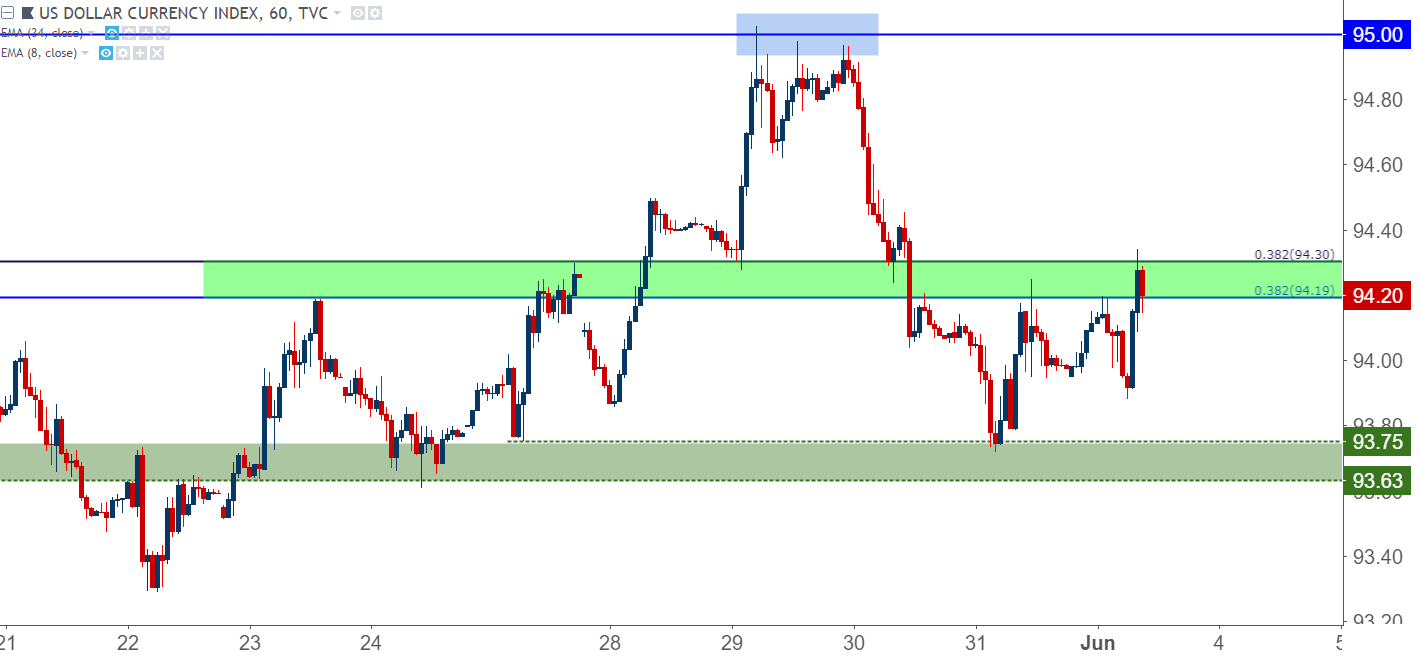
Chart prepared by James Stanley
Light Economic Calendar Leads into FOMC in Second Week of June
Next week’s economic calendar is rather light, and the week after that brings us the June FOMC rate decision. Expectations have long been primed for a hike at this meeting, but the bigger question is whether or not the Fed sees a fourth hike in 2018. This will be deduced from the dot plot matrix, and if we do see a more-hawkish Fed bump the median expectation up to four from the prior three, the backdrop for a continuation of USD strength could get a bit more accommodating.
But – until we get to that Fed meeting in the second week of June, market participants will continue to read the tea leaves in the effort of positioning ahead of that rate decision. The highlight of next week’s calendar is an RBA rate decision on Monday night/Tuesday morning, followed by Australian GDP for Q1 later in the day. Friday brings another batch of high-impact events with Canadian Jobs numbers followed by Chinese CPI.
DailyFX Economic Calendar: High-Impact Events for the Week of June 4th, 2018

Chart prepared by James Stanley
EUR/USD Holds Confluent Resistance Zone
We looked at a confluent area of resistance in EUR/USD yesterday that runs from 1.1685-1.1736. This zone had functioned as support in the latter-third of last year, and after Wednesday’s Euro-bounce pushed prices back up to this area, we’ve now seen two days of sellers responding here.
Current resistance is showing around the 23.6% Fibonacci retracement of the recent bearish move, and this keeps the door open for short-side strategies in the pair as we move deeper into the month of June.
EUR/USD Daily Chart: Resistance Holds in Confluent Zone
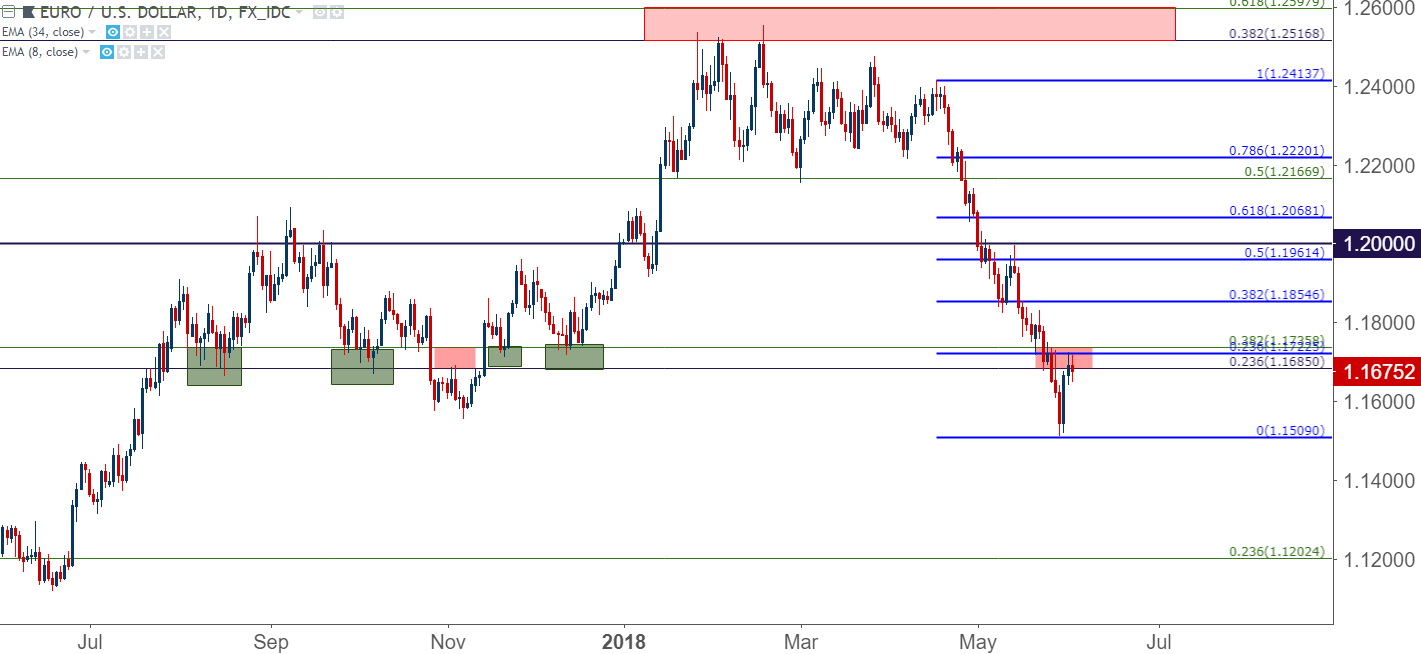
Chart prepared by James Stanley
For those looking for a bit of bearish confirmation before looking to trigger, a break of yesterday’s swing-low around 1.1640 could be used to look for bearish continuation in the short-term move.
EUR/USD Hourly Chart

Chart prepared by James Stanley
Yen Weakness Shows Again
One of the more relevant price action events of the past 24 hours has been a return of Yen-weakness. When looking at USD/JPY in yesterday’s webinar, I remarked that near-term price action was a mess; and since then matters have begun to clear up a bit as USD/JPY has moved back above a key area on the chart. This is the 38.2% Fibonacci retracement of the 2015-2016 major move in the pair, and this has been a relevant intra-day level now for more than a month.
USD/JPY remained bullish through the first few weeks of May, pulling back when it looked like the US-NK summit was called-off, and as tensions with China over the topic of trade wars took the headlines once again. But – as that fear has receded, and as it now looks as though the US-NK summit is back on, Yen-weakness has returned and USD/JPY has re-engaged back-above 109.19.
USD/JPY Four-Hour Chart

Chart prepared by James Stanley
As we looked at in yesterday’s webinar, a break back-above this level re-opens the door for bulls, and a pullback to higher-low support at this area could be an attractive top-side trigger, opening the door for a move of bullish continuation.
USD/JPY Hourly Chart: Bullish Continuation Potential
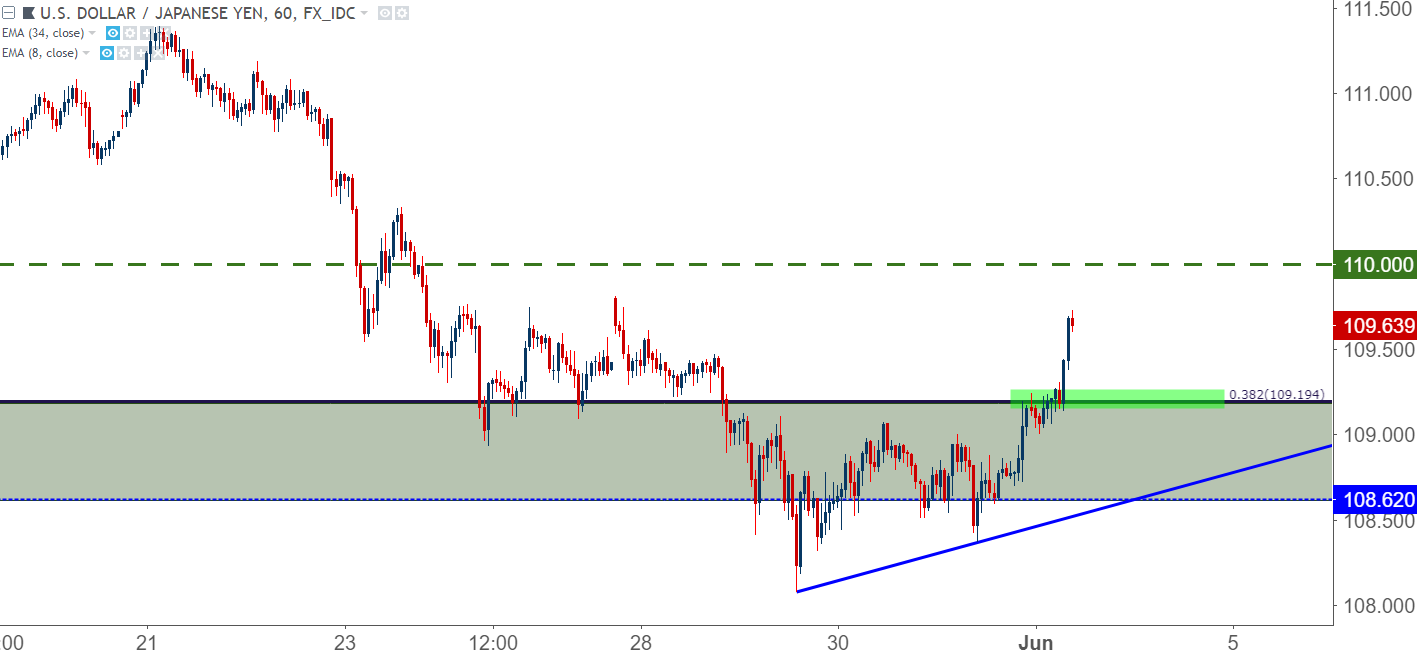
Chart prepared by James Stanley
On the other side of the US Dollar, the behavior change in USD/CHF continues to show. USD/CHF moved-higher in a very consistent manner from mid-February into the month of May. The move from mid-April to beyond the parity level was particularly smooth; but once we got above 1.0000, matters began to change. Strength slowed and, eventually, sellers were prodding lower-lows and lower-highs.
USD/CHF Daily Chart
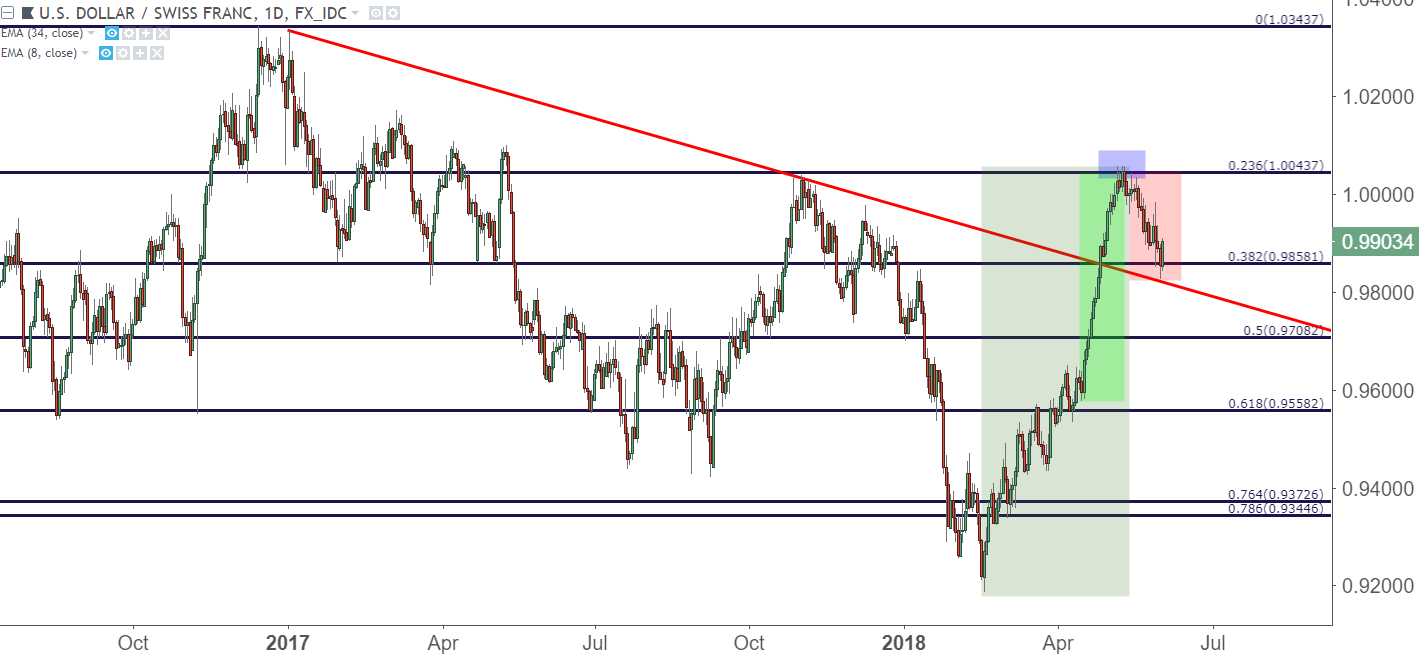
Chart prepared by James Stanley
At this point, with USD bumping-higher after this morning’s NFP report, prices have moved up to test resistance at a prior area of short-term support around .9900. Prices remaining below .9935-.9950 keeps the door open for bearish strategies as we move deeper into the month of June.
USD/CHF Four-Hour Chart
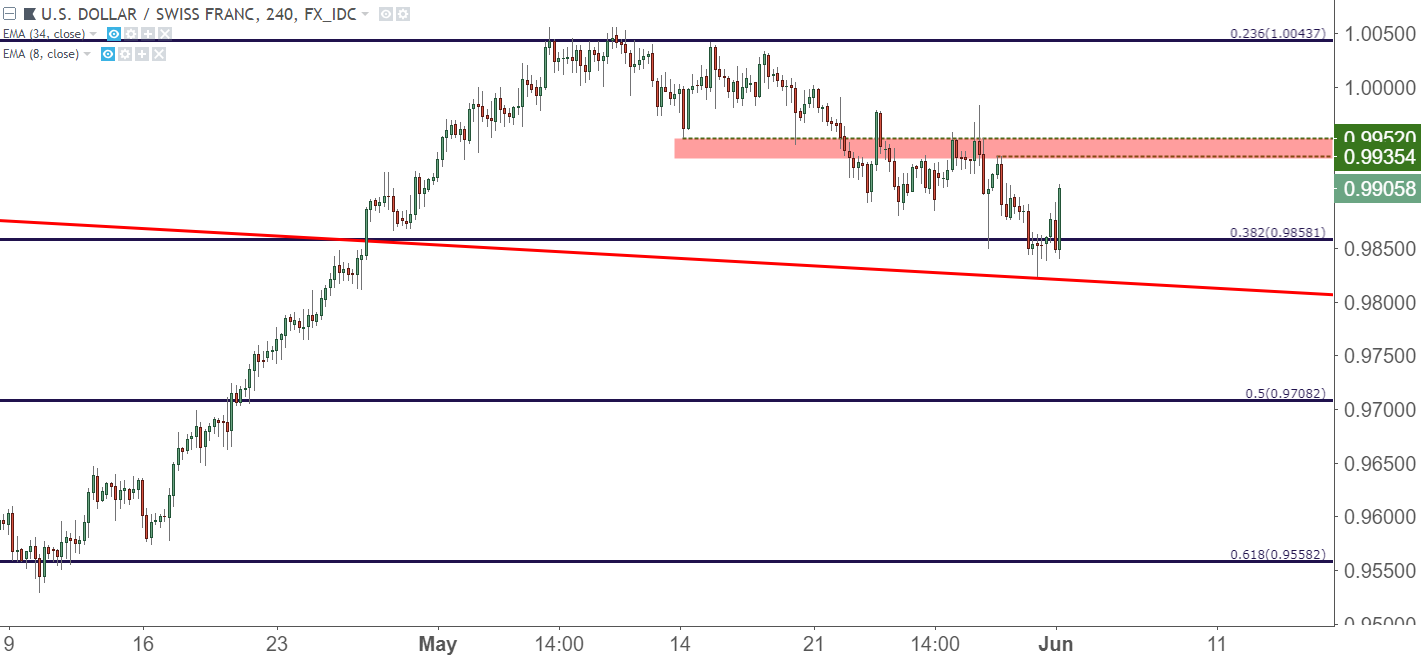
Chart prepared by James Stanley
To read more:
Are you looking for longer-term analysis on the U.S. Dollar? Our DailyFX Forecasts for Q1 have a section for each major currency, and we also offer a plethora of resources on USD-pairs such as EUR/USD, GBP/USD, USD/JPY, AUD/USD. Traders can also stay up with near-term positioning via our IG Client Sentiment Indicator.
Forex Trading Resources
DailyFX offers a plethora of tools, indicators and resources to help traders. For those looking for trading ideas, our IG Client Sentiment shows the positioning of retail traders with actual live trades and positions. Our trading guides bring our DailyFX Quarterly Forecasts and our Top Trading Opportunities; and our real-time news feed has intra-day interactions from the DailyFX team. And if you’re looking for real-time analysis, our DailyFX Webinars offer numerous sessions each week in which you can see how and why we’re looking at what we’re looking at.
If you’re looking for educational information, our New to FX guide is there to help new(er) traders while our Traits of Successful Traders research is built to help sharpen the skill set by focusing on risk and trade management.
--- Written by James Stanley, Strategist for DailyFX.com
Contact and follow James on Twitter: @JStanleyFX


