


Talking Points:
- The US Dollar stopped short of a big zone of resistance yesterday just ahead of the release of FOMC meeting minutes from the earlier-May rate decision. After the release of those meeting minutes, prices have been tilting-lower, and the US Dollar is continuing to show a series of shorter-term lower-lows and lower-highs. Meanwhile, EUR/USD is showing some element of support around a big zone of Fibonacci support has come into play as buyers are attempting to take a stand.
- Next week is interesting: Monday is a holiday in the United States, but the rest of the week brings a high-impact release each day of the week. Consumer Confidence is released on Tuesday followed by GDP, PPI and Advanced Trade Balance on Wednesday. Core CPI is released on Thursday, and Non-Farm Payrolls and NFP comes out on Friday. This presents a ripe environment for USD-volatility. The next FOMC meeting is two week later.
- DailyFX Forecasts have been updated for Q2, and are available from the DailyFX Trading Guides page. If you’re looking to improve your trading approach, check out Traits of Successful Traders. And if you’re looking for an introductory primer to the Forex market, check out our New to FX Guide.
Do you want to see how retail traders are currently trading the US Dollar? Check out our IG Client Sentiment Indicator.
US Dollar Drops From Resistance After FOMC Minutes Release
Yesterday’s release of FOMC minutes seemed to pave the way for a rate hike at the bank’s next meeting in June. This has long been expected, so it should come as no surprise; but more interesting was the fact that the Fed seemed to avoid getting too detailed with the second half of the year. So, at this point, we’re still in that space where we’re looking at a total of either three or four hikes in 2018, assuming that we get that second adjustment in a couple of weeks when the Fed meets.
The net response from the release of those FOMC minutes, at least thus far, hasn’t been all that positive. The US Dollar rallied into the release, stopping short of a big zone of resistance and turning-lower around 2:00 PM just as that report was making its way into markets. Since then, it’s been a bearish show with a continuation of lower-lows and lower-highs.
US Dollar via ‘DXY’ Five-Minute Chart: Turning After Resistance, FOMC Minutes
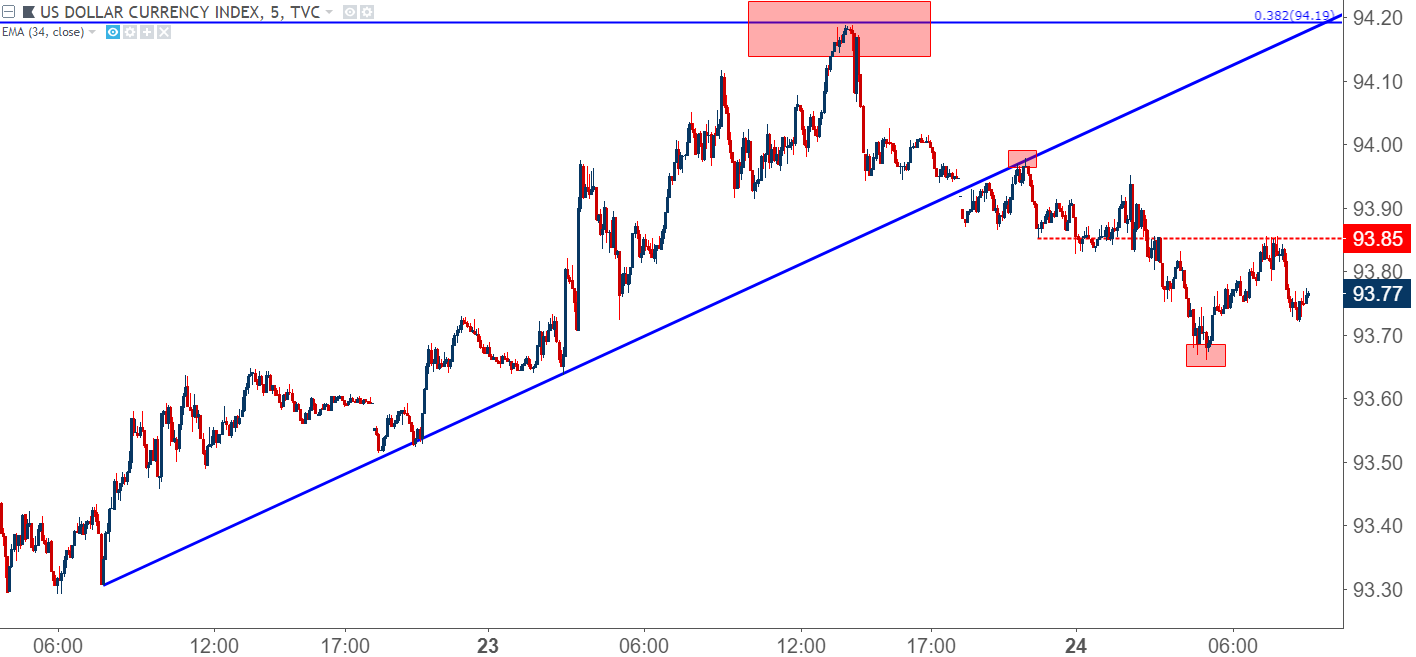
Chart prepared by James Stanley
On a longer-term basis, the bullish structure remains even after prices pulled back from resistance at the 38.2% retracement of the US Dollar’s down-trend that started last year. This level is confluent with another 38.2% Fibonacci retracement from a longer-term move, taking the bullish trend that started in 2014 and ran into last year. This zone had helped to form monthly highs in both August and December of last year, along with another iteration in early-October.
US Dollar Pulls Back Shy of Confluent Fibonacci Resistance, Prior December Swing-High

Chart prepared by James Stanley
Next Week's Economic Calendar with Heavy USD-Focus
Next week starts off with a holiday in the US. But after that – the economic calendar has high-impact USD data coming out every day of next week, capped-off with NFP on Friday. Then, two weeks later, we get that June FOMC rate decision. This produces an interesting environment for USD-volatility, especially as this longer-term zone of resistance has recently come into play.
DailyFX Economic Calendar: Next Week is Big for the US Dollar
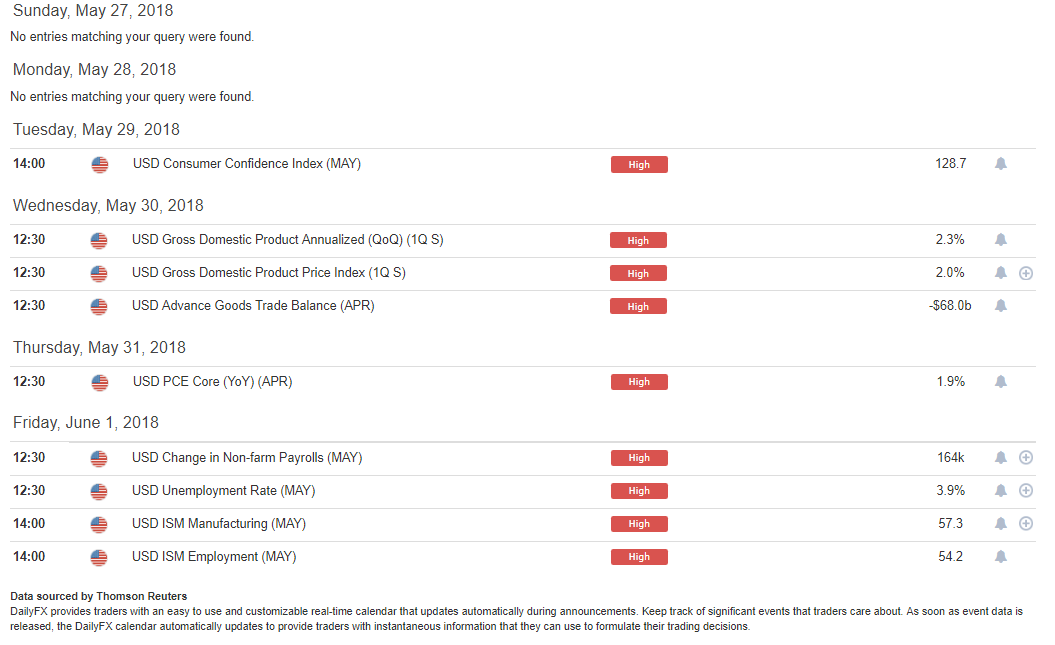
Chart prepared by James Stanley
EUR/USD Bounces From Fibonacci Support
While the US Dollar has run into resistance, we have a corresponding move of EUR/USD digging-into support. This comes from a zone that was active in 2017, helping to provide support on multiple occasions from August into the end of the year. At 1.1736 we have the 38.2% retracement of the 2014-2017 major move, and at 1.1685 we have the 23.6% retracement of the 2008-2017 major move.
EUR/USD Daily Chart: Drop into Familiar Zone of Fibonacci Support

Chart prepared by James Stanley
On a shorter-term basis, we can see a bit of battle going on as bulls are trying to cauterize support down here. Earlier in the week, we saw a bounce off the upper-portion of the area, but this was met with sellers after another test of 1.1825, leading into a deeper move within the zone until buyers started to show at 1.1685 – and that test came-in just before yesterday’s release of FOMC minutes.
At this stage, bulls are trying to make a stand, and it’s still early; but a print up to fresh highs at 1.1750 opens the door for a re-test of swing-high resistance around 1.1825.
EUR/USD Hourly Chart: Bulls Attempt to Take a Stand

Chart prepared by James Stanley
GBP/USD: Cable Finally Finds Support, But Can it Hold?
Earlier this week we looked into GBP/USD, plotting short-side approaches off of resistance around 1.3500. That setup filled-in early on Tuesday, and since then we’ve had a run down to the next area of support that we were following, straddled around the 1.3300-handle.
GBP/USD Four-Hour Chart: Cable Catches Support
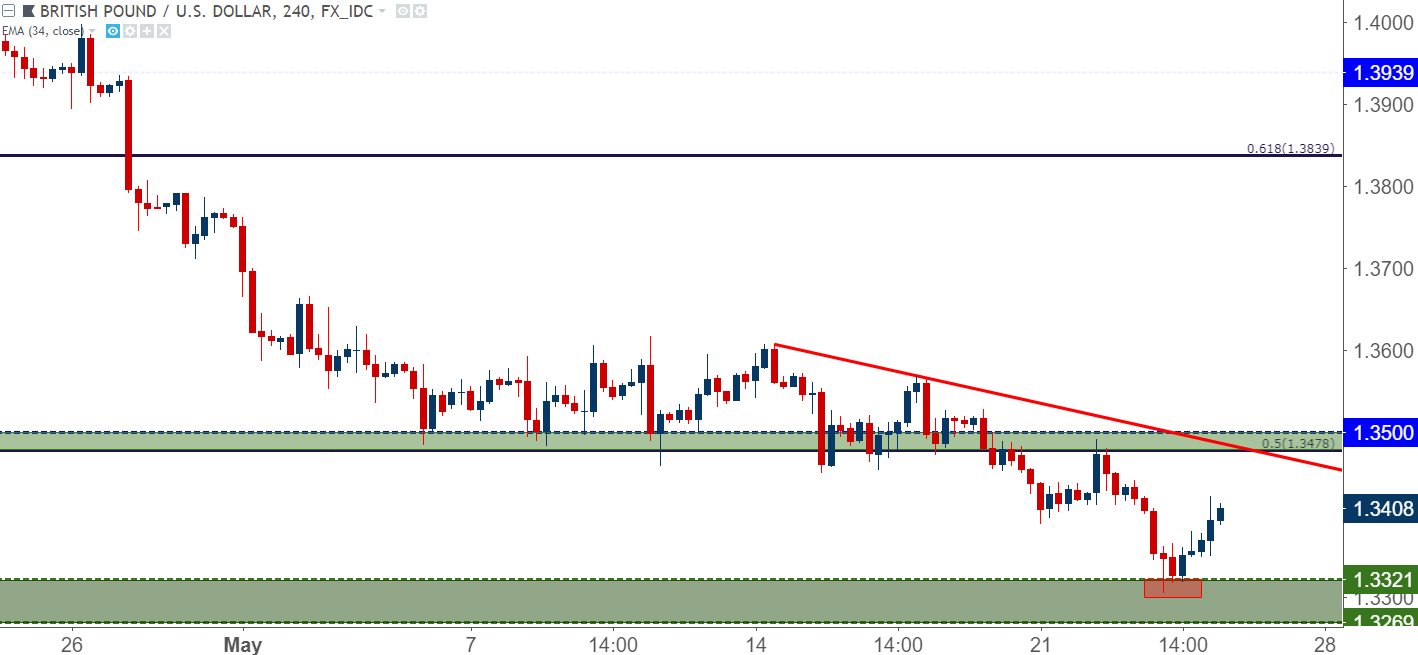
Chart prepared by James Stanley
On a shorter-term basis, this bullish move looks corrective in nature. Prices rallied up to prior swing-lows shortly after the Euro-open, and has since found sellers. This helps to keep the pair in a near-term bearish stance until we get a sustained-break back-above the 1.3500 level.
GBP/USD Hourly Chart: Cable Catches Shorter-Term Resistance
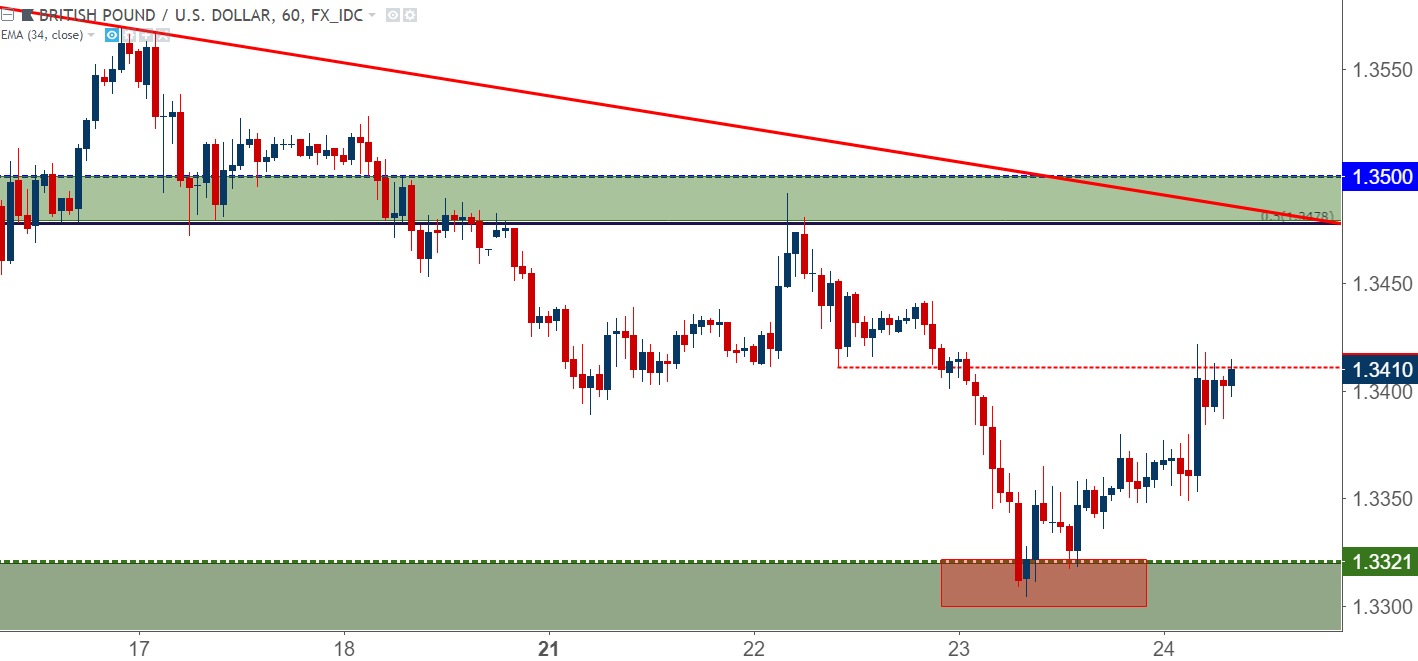
Chart prepared by James Stanley
USD/JPY Gives Back Gains, Nears Critical Decision Point
USD/JPY went on a rip-roaring run last week, driven in large part by the soothing relations between the US and China. With tensions on their way back-up, Yen-strength has started to show again and USD/JPY is back-below the vaulted 110.00 level. But – perhaps more important to the near-term bullish structure in the pair is a zone of support that runs from 108.62 up to 109.19. This area caught quite a bit of gyration from late-April into early-May, and this keeps the door open for top-side strategies. But – if we fail to hold-above, we’re likely seeing some element of risk aversion, and Yen-weakness becomes rather unattractive in that backdrop. Traders could, instead, look to buy JPY against currencies like the Euro, British Pound or even the US Dollar. Until then, watch support in USD/JPY.
USD/JPY Hourly Chart: Nearing Test of Big Support Zone 108.62-109.19
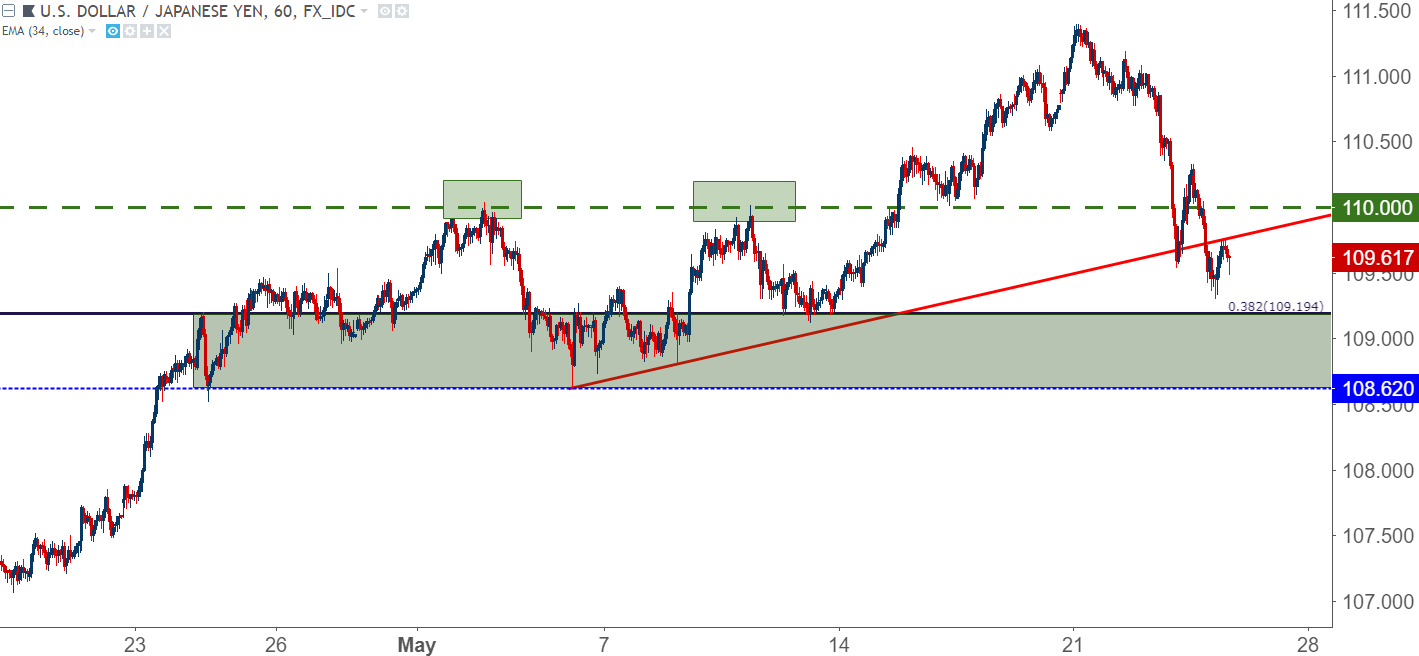
Chart prepared by James Stanley
For USD-Weakness Scenarios, USD/CHF Remains of Interest
USD/CHF was a freight train over the past month, and to a lesser-degree, over the past three months. Coming into 2018 this was one of the more attractive pairs for USD-weakness, as that bearish theme in the Dollar was being met with a bullish theme in the Swiss Franc. But as the Dollar started to bottom in mid-February, the switch was flipped and the pair began to rally. In April, that bullish theme started to take-on a life of its own, exhibiting one of the cleanest short-term trends possible, eventually running into the parity level in early-May. Since then, we had a bit of range for two weeks, and the pair has started to break-lower this week.
USD/CHF Four-Hour: Smooth Bullish Trend Shows Signs of Flipping, Lower-Lows, Highs
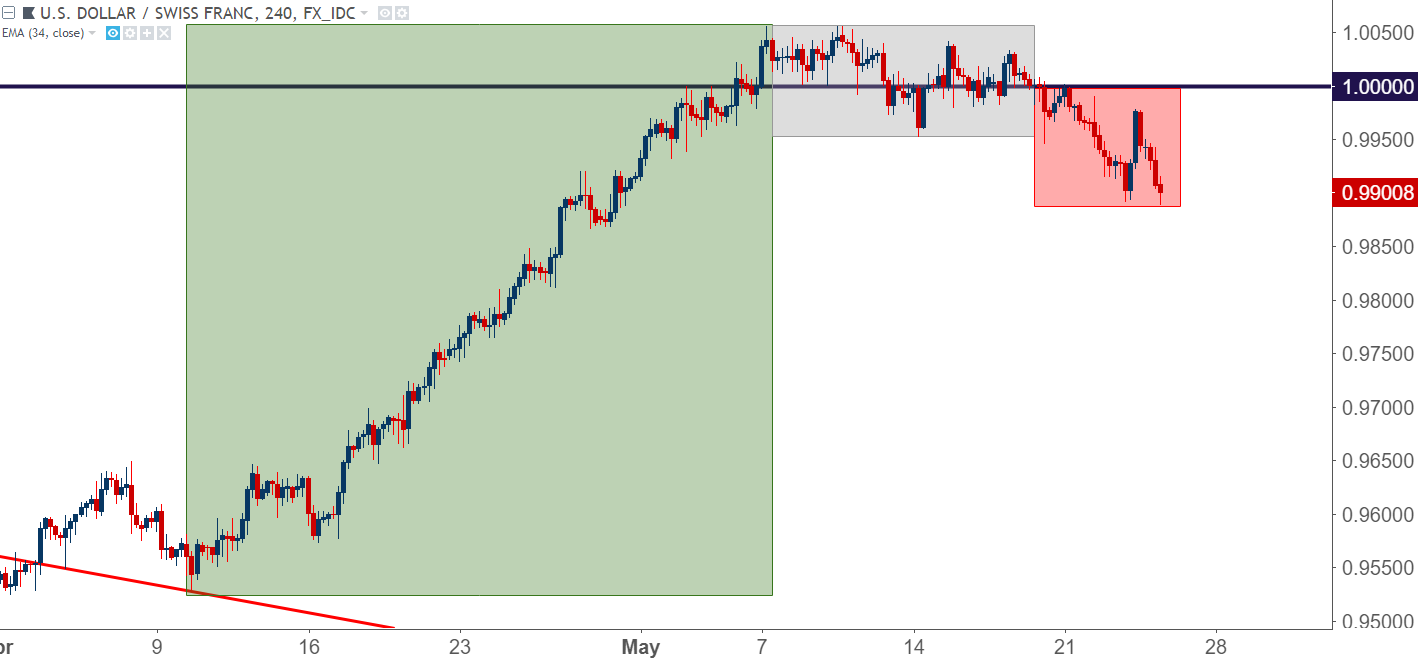
Chart prepared by James Stanley
On the weekly chart, the setup is perhaps even a bit more compelling, as we have four consecutive weeks of resistance tests showing around parity, with sellers finally starting to grasp control this week. This is very similar to what happened in September of last year around the same level, and this can keep the door open for short-side approaches in USD/CHF, particularly for those looking to fade this recent run of USD-strength.
USD/CHF Weekly Chart: Turning at the Familiar Area of Parity

Chart prepared by James Stanley
To read more:
Are you looking for longer-term analysis on the U.S. Dollar? Our DailyFX Forecasts for Q1 have a section for each major currency, and we also offer a plethora of resources on USD-pairs such as EUR/USD, GBP/USD, USD/JPY, AUD/USD. Traders can also stay up with near-term positioning via our IG Client Sentiment Indicator.
Forex Trading Resources
DailyFX offers a plethora of tools, indicators and resources to help traders. For those looking for trading ideas, our IG Client Sentiment shows the positioning of retail traders with actual live trades and positions. Our trading guides bring our DailyFX Quarterly Forecasts and our Top Trading Opportunities; and our real-time news feed has intra-day interactions from the DailyFX team. And if you’re looking for real-time analysis, our DailyFX Webinars offer numerous sessions each week in which you can see how and why we’re looking at what we’re looking at.
If you’re looking for educational information, our New to FX guide is there to help new(er) traders while our Traits of Successful Traders research is built to help sharpen the skill set by focusing on risk and trade management.
--- Written by James Stanley, Strategist for DailyFX.com
Contact and follow James on Twitter: @JStanleyFX


