


Talking Points:
- Global markets took a step back from the ledges of risk aversion yesterday, and this helped to soften the US Dollar after an aggressive sell-off in EUR/USD helped DXY to test the 95.00 level. As political volatility in Europe has started to calm, EUR/USD has put-in a 23.6% retracement of the prior bearish move, and currently sits at a big zone of resistance as we approach the release of tomorrow’s Non-Farm Payroll data out of the United States.
- One of the knock-on effects of this week’s earlier flare of volatility was a pullback in expectations for rate hikes out of the Fed this year, and the prospect of four rate hikes in 2018 now looks not so certain. This has helped that pullback in the US Dollar, and market participants will be focusing on data as we approach that next FOMC rate decision in a couple of weeks. While a hike in June is still high-probability, the larger focus will be on the Fed’s dot plot matrix, looking at whether the bank is leaning towards an additional one or two hikes in 2018.
- DailyFX Forecasts have been updated for Q2, and are available from the DailyFX Trading Guides page. If you’re looking to improve your trading approach, check out Traits of Successful Traders. And if you’re looking for an introductory primer to the Forex market, check out our New to FX Guide.
Do you want to see how retail traders are currently trading the US Dollar? Check out our IG Client Sentiment Indicator.
US Dollar Pullback Continues Through Support as Risk Aversion Takes a Step Back
It’s been an active 24 hours across markets, and the action continues into this morning as we approach tomorrow’s release of Non-Farm Payrolls data out of the United States. One of the big movers on the week has been the US Dollar, finally staging some element of retracement after what’s become an aggressively bullish prior six weeks. DXY surged into the 95.00 level on Tuesday, and after grinding there for a bit, sellers were able to take over to bring the Greenback back to support. We looked at that support zone yesterday, and that was unable to hold as sellers have continued to retrace that prior bullish move.
Helping that support break has been a pullback in rate hike bets around the US, and this appears to be a knock-on effect of the volatility that’s started to show in European politics. As we looked at yesterday, markets have started to pull back expectations around rate hike bets from the Federal Reserve this year as European political volatility started to crank-up. Odds for a hike at the banks next meeting in a couple of weeks moderated slightly, but the noteworthy move was in the expectation for a total of four rate hikes this year, which currently sits at 27.7%.
As we move towards that next FOMC rate decision, focus is on US data as market participants try to read the tea leaves to see just how aggressive the Fed might be looking to guide rates in the second half of this year. So, as has become usual – the focus will be on the dot plot matrix, and as we approach that, the focus will be on data points that may compel the Fed in one direction or the other. Tomorrow brings a big data point on that front with the release of May Non-Farm Payroll Numbers out of the United States. The expectation is for 190,000 jobs to have been added to American payrolls last month, and a considerable focus will be directed to the Average Hourly Earnings portion of the report in the effort of seeing impact to wage gains (inflation).
US Dollar Hourly Chart: USD Pulls Back After Failed Test at 95.00

Chart prepared by James Stanley
On a longer-term basis, we can see where this current run of US Dollar strength has started to pull back short of the November swing-high. Given this week’s dynamics, we’ve also seen a candle-body pivot around the zone of resistance that runs from 94.19-94.30. This keeps interest around the potential for a deeper pullback, particularly in non-Euro pairs. Coming into this week, we looked at topside setups in AUD/USD and NZD/USD as a way to look at short-US Dollar scenarios. Each of those remain viable options for playing continued weakness in the US Dollar.
US Dollar Weekly Chart: Reversal Week So Far, NFP On Deck

Chart prepared by James Stanley
Euro Pullback Continues into Resistance as European Political Volatility Slows
Coming into this week we had some very real concerns around increasing political volatility in Europe, as the prospect of ‘Ital-exit’ started to gain a bit of steam. That theme started to step back from the ledge yesterday, and we’ve seen a continued calm since. At this point, it looks as though the majority parties in Italy are going to get more time to form a working government. This is key – as a working government is a requirement to be part of the European Stability Mechanism (ESM), and membership within the ESM is a requirement to trigger the ECB’s OMT (Outright Monetary Transactions). This is like a safety net in case matters in Italy got really, really bad, and in our current space this presents a challenge as Italy has been unable to form a working government. With no working government, there is legitimate fear of what backstops might be able to slow or stem the tide of a run on Italian debt, and this is likely the culprit behind that outsized sell-off seen in those markets earlier this week.
EUR/USD Daily Chart: Pullback to Resistance Zone, Prior Support
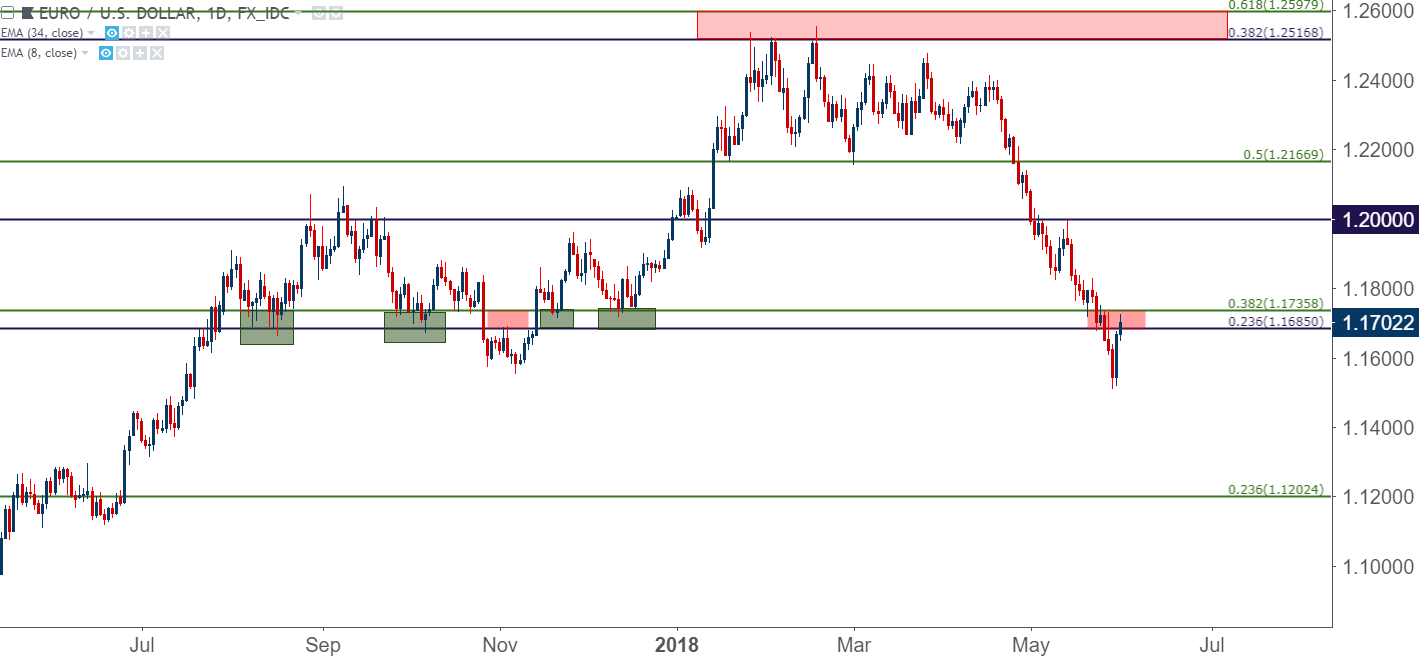
Chart prepared by James Stanley
On a shorter-term basis, we can see where the two-day rally in EUR/USD has produced a 23.6% Fibonacci retracement of the prior sell-off that started in mid-April. This also helps to highlight how a break above the current zone of resistance exposes another area of interest, and this is around the 38.2% retracement of that same move.
EUR/USD Four-Hour Chart: 23.6% Pullback into Resistance Zone
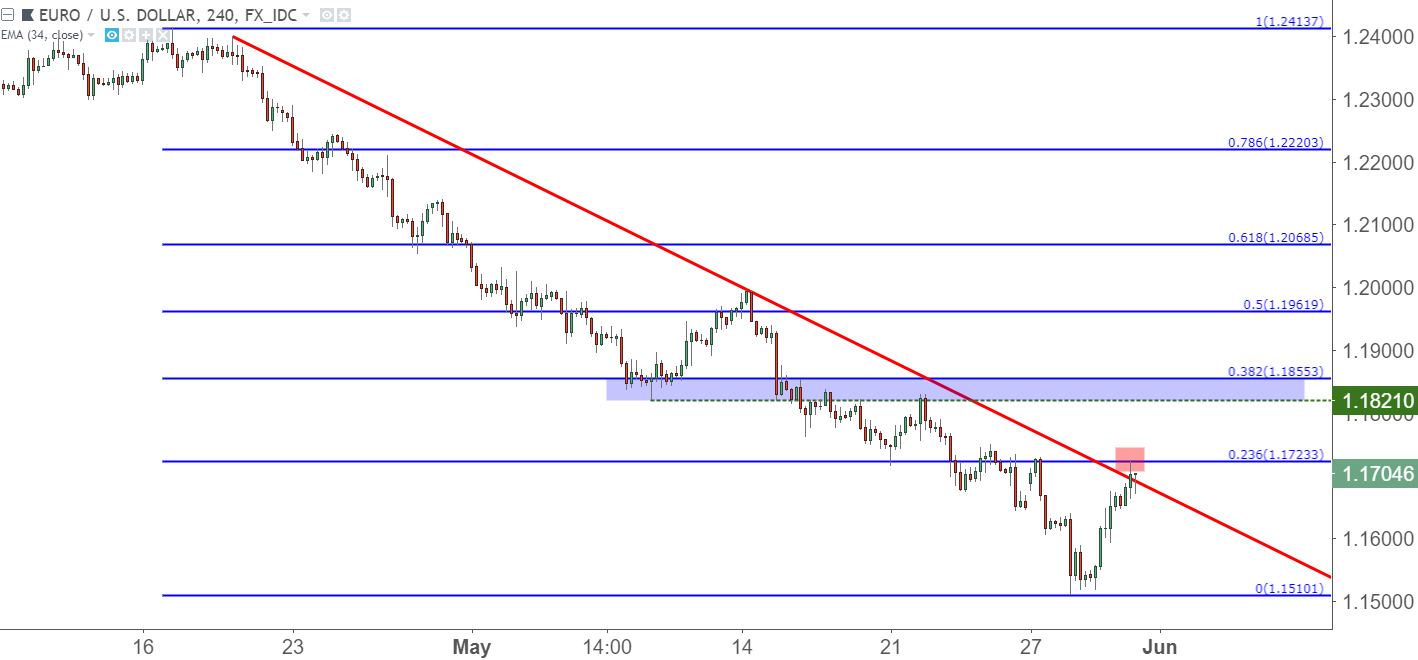
Chart prepared by James Stanley
Long-Term NZD/USD Range Begins to Fill-In
Coming into this week, we looked at bullish setups in AUD/USD and NZD/USD as ways to get short the US Dollar, helping to balance out long-USD exposure in a EUR/USD setup.
The basis for t he NZD/USD setup was the same that we’d used in mid-April going in the opposite direction, and that’s a longer-term range that’s been in-effect now for almost two years. In mid-April, prices began to fall from resistance, and this came-in right as that rush of strength was starting to show in the US Dollar. Five weeks later, prices in NZD/USD had already fallen to the support side of the formation, and after a bit of grind last week, prices have started to bump-higher.
This has certainly been helped by that pullback in the US Dollar, as driven by weaker US rate expectations; but the potential for more remains, particularly should that theme of USD weakness come further into the spotlight as led by diminished rate expectations around the Federal Reserve for 2018.
NZD/USD Weekly Chart: Bounce From Long-Term Support Zone

Chart prepared by James Stanley
To read more:
Are you looking for longer-term analysis on the U.S. Dollar? Our DailyFX Forecasts for Q1 have a section for each major currency, and we also offer a plethora of resources on USD-pairs such as EUR/USD, GBP/USD, USD/JPY, AUD/USD. Traders can also stay up with near-term positioning via our IG Client Sentiment Indicator.
Forex Trading Resources
DailyFX offers a plethora of tools, indicators and resources to help traders. For those looking for trading ideas, our IG Client Sentiment shows the positioning of retail traders with actual live trades and positions. Our trading guides bring our DailyFX Quarterly Forecasts and our Top Trading Opportunities; and our real-time news feed has intra-day interactions from the DailyFX team. And if you’re looking for real-time analysis, our DailyFX Webinars offer numerous sessions each week in which you can see how and why we’re looking at what we’re looking at.
If you’re looking for educational information, our New to FX guide is there to help new(er) traders while our Traits of Successful Traders research is built to help sharpen the skill set by focusing on risk and trade management.
--- Written by James Stanley, Strategist for DailyFX.com
Contact and follow James on Twitter: @JStanleyFX


