


Talking Points:
- This will be a big week for the US Dollar, and the Greenback is getting started with a full head of steam after the bullish breakouts of the past couple of weeks. Those breakouts were largely induced from deductive pushes, as falling inflation created more passive backdrops in Europe, the UK and Japan; and more dovish stances at the ECB, BoE and BoJ have elicited weakness in the native currency, thereby pushing strength in the US Dollar. With a full slate of USD-related items on the calendar for this week, the big question is whether the US Dollar con continue this topside run.
- The US Dollar is showing a bear flag formation, and given support structure in EUR/USD and GBP/USD, reversal plays could prove interesting. For a continuation of USD-strength, commodity currencies could remain as attractive candidates, and we look at setups below in AUD/USD, NZD/USD and USD/CAD.
- DailyFX Forecasts have been updated for Q2, and are available from the DailyFX Trading Guides page. If you’re looking to improve your trading approach, check out Traits of Successful Traders. And if you’re looking for an introductory primer to the Forex market, check out our New to FX Guide.
Do you want to see how retail traders are currently trading the US Dollar? Check out our IG Client Sentiment Indicator.
US Dollar Continues to Run Ahead FOMC, NFP
This will not be a quiet week for the US Dollar, as the April bullish breakout will be in the spotlight as we get as series of high impact USD drivers. The data flow has already started with the release of PCE for the month of March, and later in the week we get a FOMC rate decision on Wednesday followed by Non-Farm Payrolls on Friday. We’re also getting some key European data, and after last week’s sell-off in the Euro, investors will be looking for signs of weakening inflation or down-trending fundamentals in order to gauge whether there might be a deeper sell-off in the single currency. And then next week brings a Super Thursday rate decision out of the Bank of England that could continue to prod volatility into the Pound, after last week’s dizzying sell-off that further helped to reverse earlier-April gains.
All-in-all, this sets global markets up for a volatile backdrop as we move towards the May open. The big question around currency markets will likely revolve around the US Dollar’s recent strength and whether it can continue. The down-trend in USD was alive and well for over a year; and after spending the second half of Q1 oscillating around support, buyers have staged a bullish push as we’ve moved into Q2. At this point, we’re starting to see some evidence of that longer-term bearish trend starting to give way. On the Daily chart below, we can see the bearish trend channel from last year in the initial stages of a break. Prices had found some resistance here on Friday as USD pulled back after an especially strong week, and so far today we’re seeing bulls continue that move by pushing prices right back towards that Friday high.
US Dollar via ‘DXY’ Daily Chart: Resistance Test of Bearish Channel
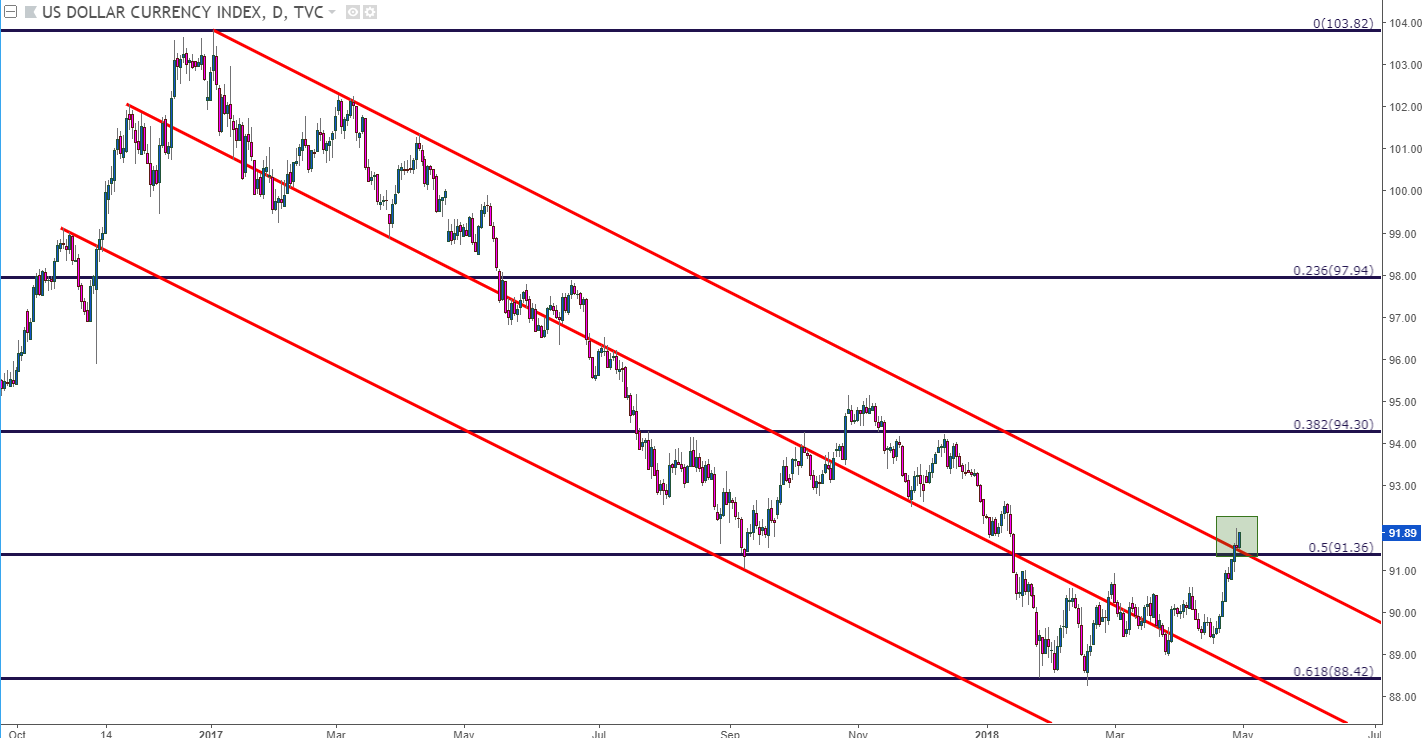
Chart prepared by James Stanley
On a longer-term basis, traders would be rightfully cautious if shying away from chasing topside. That down-trend in the Greenback was going since the beginning of last year, and this happened as the Fed was one of the few major Central Banks looking to tighten policy. This was happening as both the ECB and BoJ were continuing with dovish, passive monetary stances; but it was only the recent softening in inflation in both economies that have allowed the Euro and the Yen to weaken. Deductively, this has brought US Dollar strength – but this begs the question: Is this something that can last for long? Or is this a pullback in a longer-term theme that’s merely loading up for more?
To put this recent move of strength into scope, we’ve added a Fibonacci retracement around the US Dollar down-trend from last year, and notice that the current point of resistance is coming in at the 23.6% Fibonacci retracement. This level is also confluent, as we have resistance from a trend-line that was prior support last year, becoming resistance in 2018.
US Dollar via ‘DXY’ Daily Chart: Testing Confluent Resistance
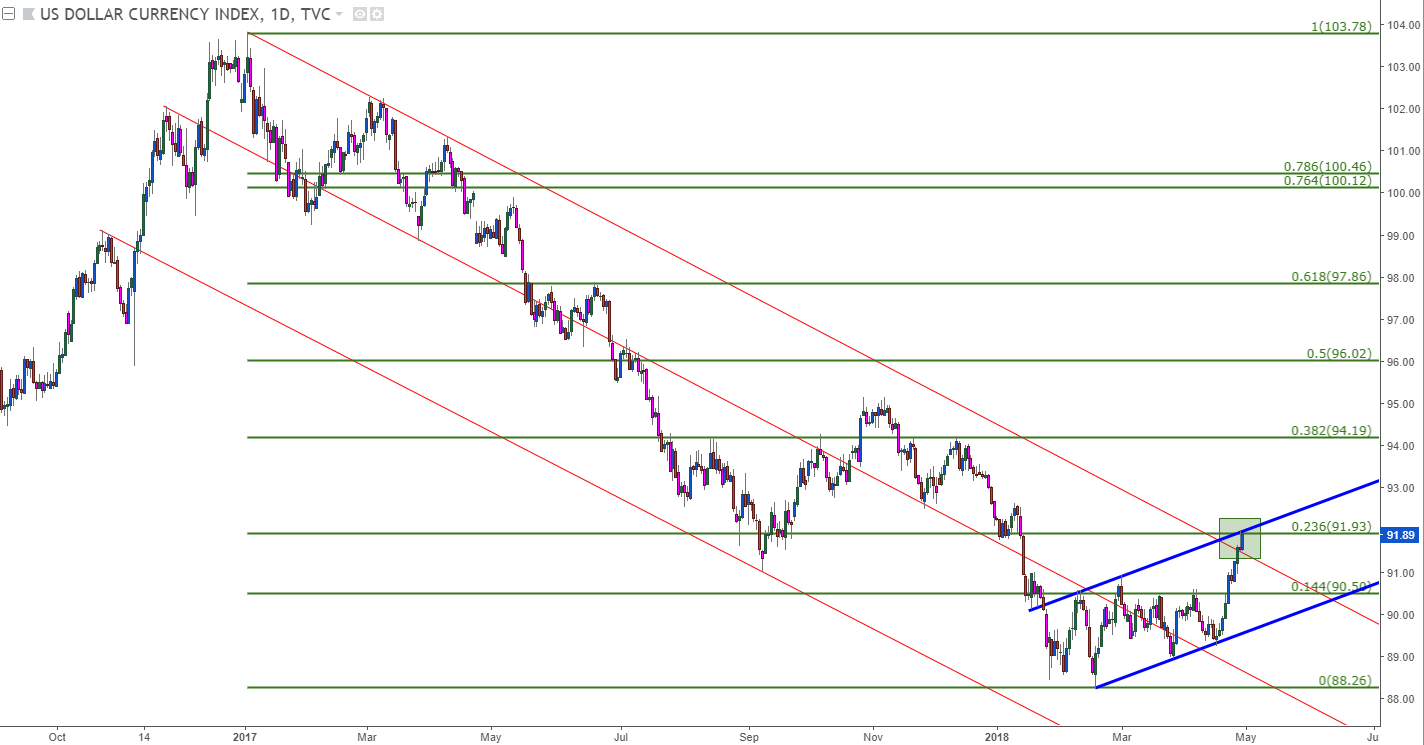
Chart prepared by James Stanley
US Dollar Strategy For This Week
Given this week’s calendar, there is a case to be made on either side of the US Dollar. The proactive approach for currency traders in such a backdrop would be to focus on areas or markets attractive under each scenario; as in which pairs would be most attractive in the event of a USD weakness coming back, and which might be most attractive in the event of strength continuing.
On the side of USD-strength, commodity currencies will likely remain as attractive. This would be pairs such as AUD/USD, NZD/USD or USD/CAD. Should USD-weakness come back, those pairs that were really hit last week would likely have some attractive reversal potential, and we’re looking at pairs like EUR/USD or GBP/USD.
EUR/USD: Deeper Support Potential Around 1.2000
EUR/USD is holding support around the ‘s2’ area that we looked at last week, and a bit deeper is another potential support level around the 1.2000 psychological level. This price of 1.2000 had previously helped to hold the highs in the pair in Q4 of last year, finally giving way in December ahead of year-end; and that led to a really sharp topside move that never really checked back to 1.2000 for support. That keeps the price interesting for reversal plays should a deeper drop come-in.
EUR/USD Daily Chart: Holds ‘S2’ Zone, Deeper Support Potential Around 1.2000
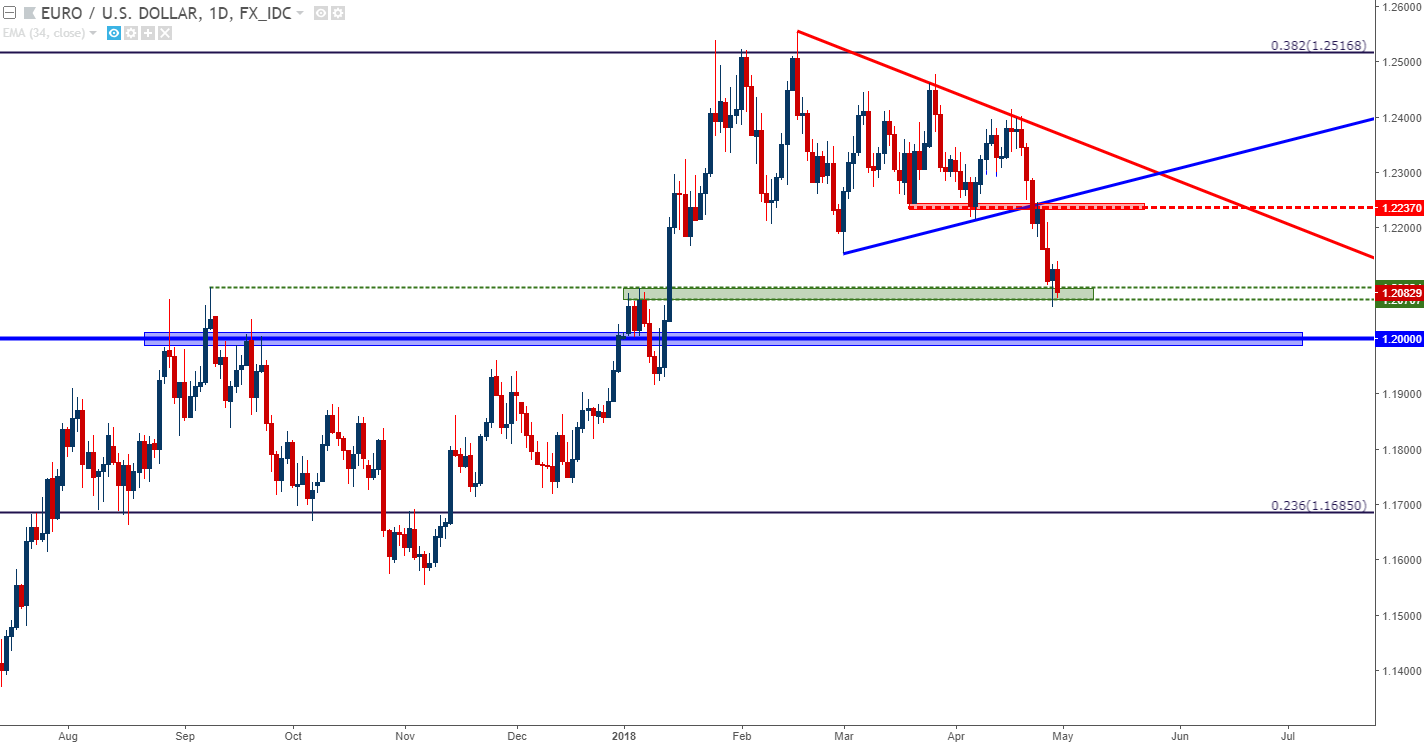
Chart prepared by James Stanley
GBP/USD Testing Channel Support at the March Lows
It’s been a chaotic month for the British Pound, as the currency came into April flying high on the prospect of a rate hike in May that doesn’t look all too certain anymore. The past couple of weeks have seen those bullish prospects disintegrate around GBP, led by a disappointing inflation print a couple of weeks ago. That led into some dovish commentary from BoE Governor, Mark Carney, and last week’s GDP print pushed those hopes for rate hikes back even more.
As we approach next week’s rate decision, there’s a strong chance that we do not get a hike. The BoE has had a pattern of being dovish, and given this recent down-draft in the data, they may have just gotten the flexibility to leave policy at par, looking instead at a potential rate hike in August or perhaps even November.
In response to that turn-around in data, we have quite the turn-around in GBP/USD, and the pair is now testing a key area of support. This price comes in around 1.3710, and this is a confluent level taken from the March low which syncs up to the support side of the 2017 bullish trend-channel. If support holds here today, this becomes interesting for a reversal play. But if that support cannot hold – look out because that bearish momentum from last week was very strong and has shown no signs yet of abating.
GBP/USD Daily Chart: Testing Channel Support at the March Lows
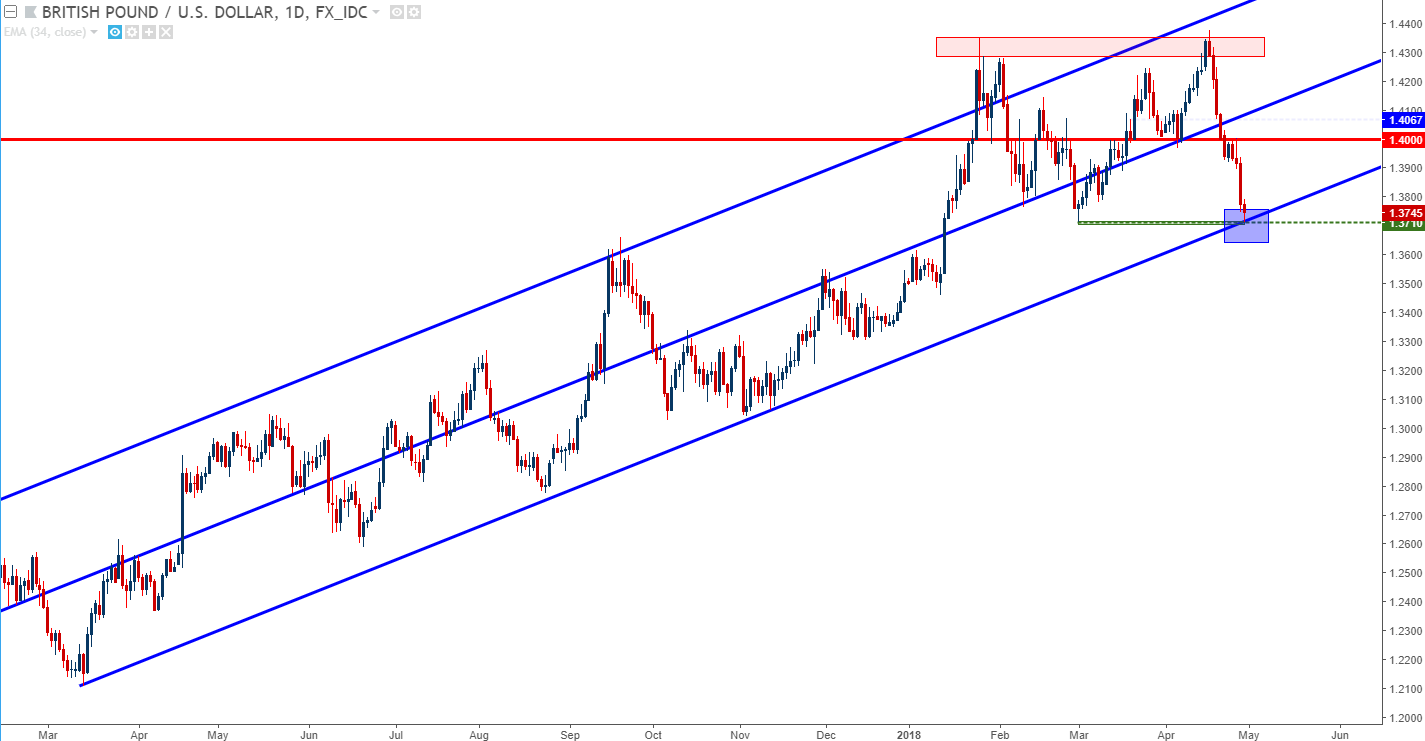
Chart prepared by James Stanley
AUD/USD Breaks Two-Year Trend-Line
As mentioned earlier, commodity currency pairs have been very attractive for USD-strength themes of recent, and last week’s move in AUD/USD took out a long-term trend-line, indicating that we may have a deeper run of bearish continuation on the cards for later this year. The trend-line in question connects 2016 and 2017 swing lows, each of which happened around the early part of the year. We had another test of this trend-line in December of 2017; but when we came in contact with this trend-line again last week, bulls couldn’t hold the lows and prices have put in a bearish break.
AUD/USD Daily Chart: Two-Year Trend-Line Gives Way
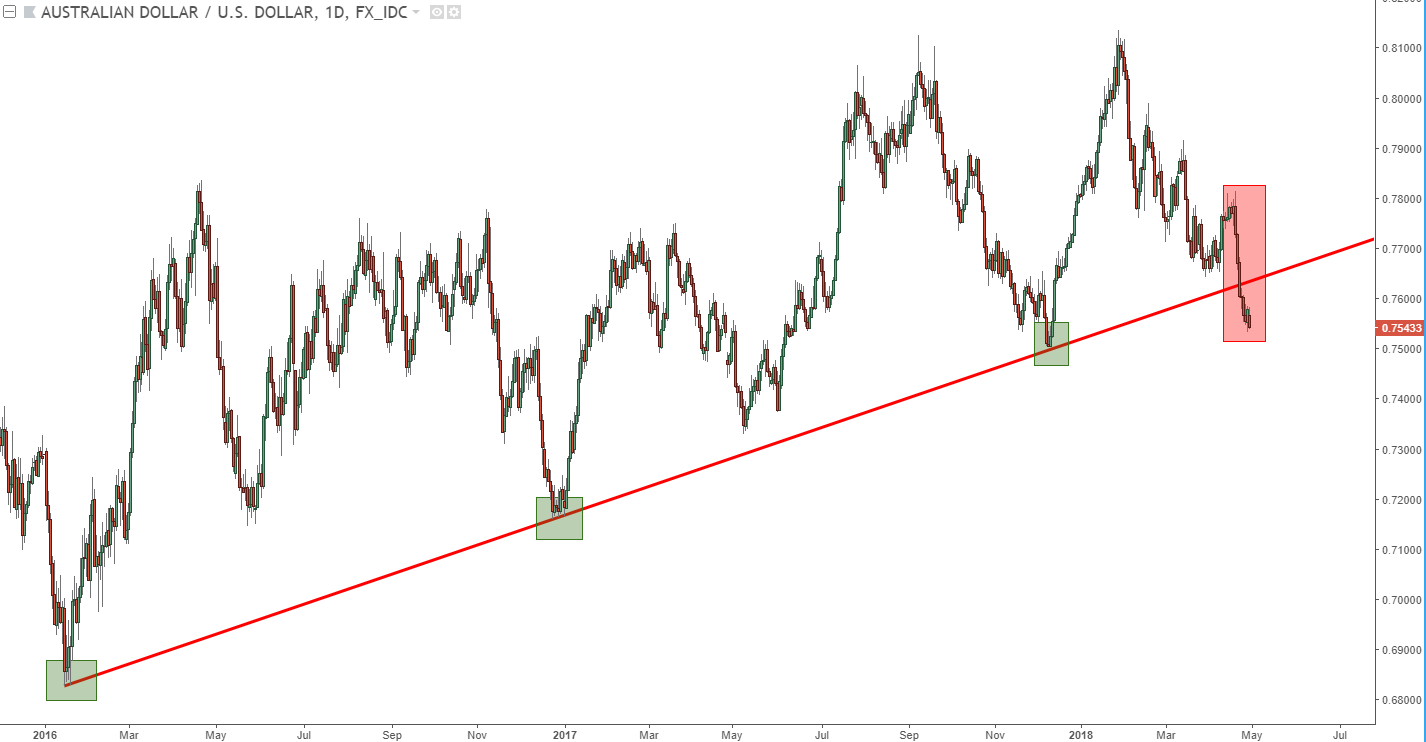
Chart prepared by James Stanley
USD/CAD Stalled at Fibonacci Resistance
The USD breakout of the past few weeks is also showing visibly in USD/CAD, as well, although the pair here put in the bulk of the move two weeks ago and spent the past three trading days ramming into a key area of Fibonacci resistance. This price is at 1.2874, and this is the 23.6% retracement of September-March bullish run. If we’re able to break above this level, the psychological level at 1.3000 is exposed, followed by the 2018 high at 1.3132.
USD/CAD Daily Chart: Build of Fibonacci Resistance Highlights Breakout Potential
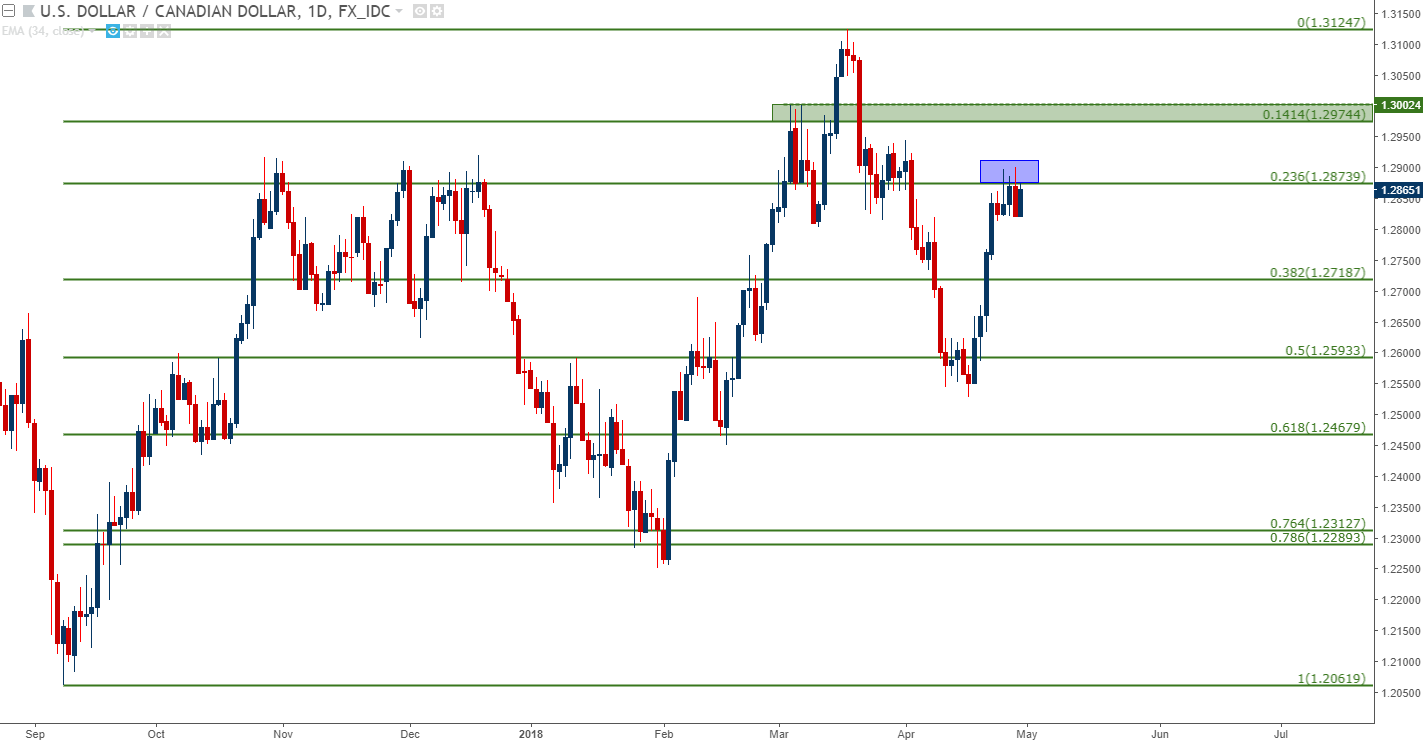
Chart prepared by James Stanley
NZD/USD Range Fill Potential
This was our favored pair for USD-strength, and we looked into a short-side setup a couple of weeks ago that quickly ran down towards target. Friday represented at fresh 2018 low, and so far on the new week it looks as though sellers are pushing right back towards that point. On Friday, we published our FX setups for this week and pulled the remaining exposure in the pair ahead of hitting that final target, instead directing short-NZD exposure towards the Euro.
NZD/USD Daily Chart: Bearish Potential With Range Continuation
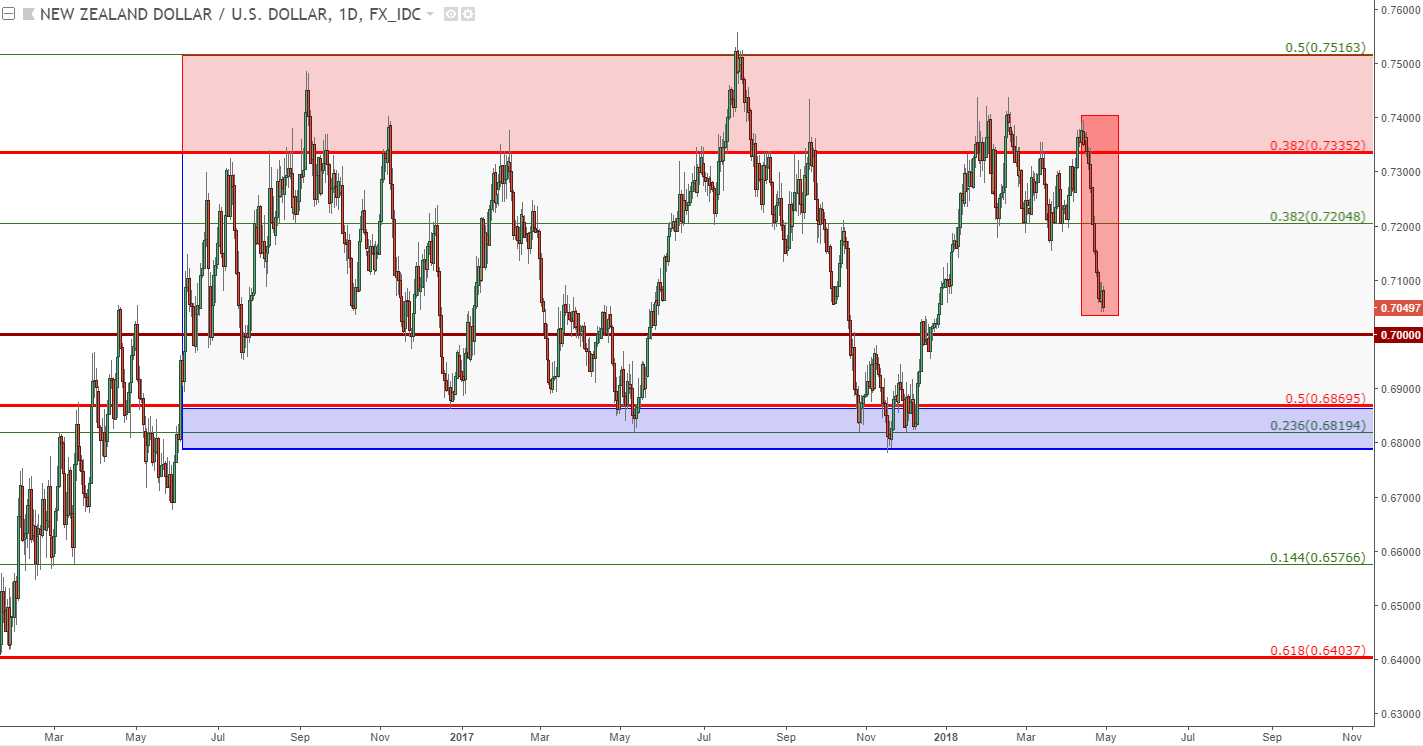
Chart prepared by James Stanley
The caution being that the move came in very quickly and given that support was showing around the .7000 big figure in a week that’s absolutely loaded with USD news, and the probability of a pullback may be a little too high to continue riding shorts at current levels. On the chart below, we look at a few points of resistance that could be interesting for bearish continuation strategies in the pair.
NZD/USD Four-Hour Chart: Potential Lower-High Resistance for Bearish Continuation
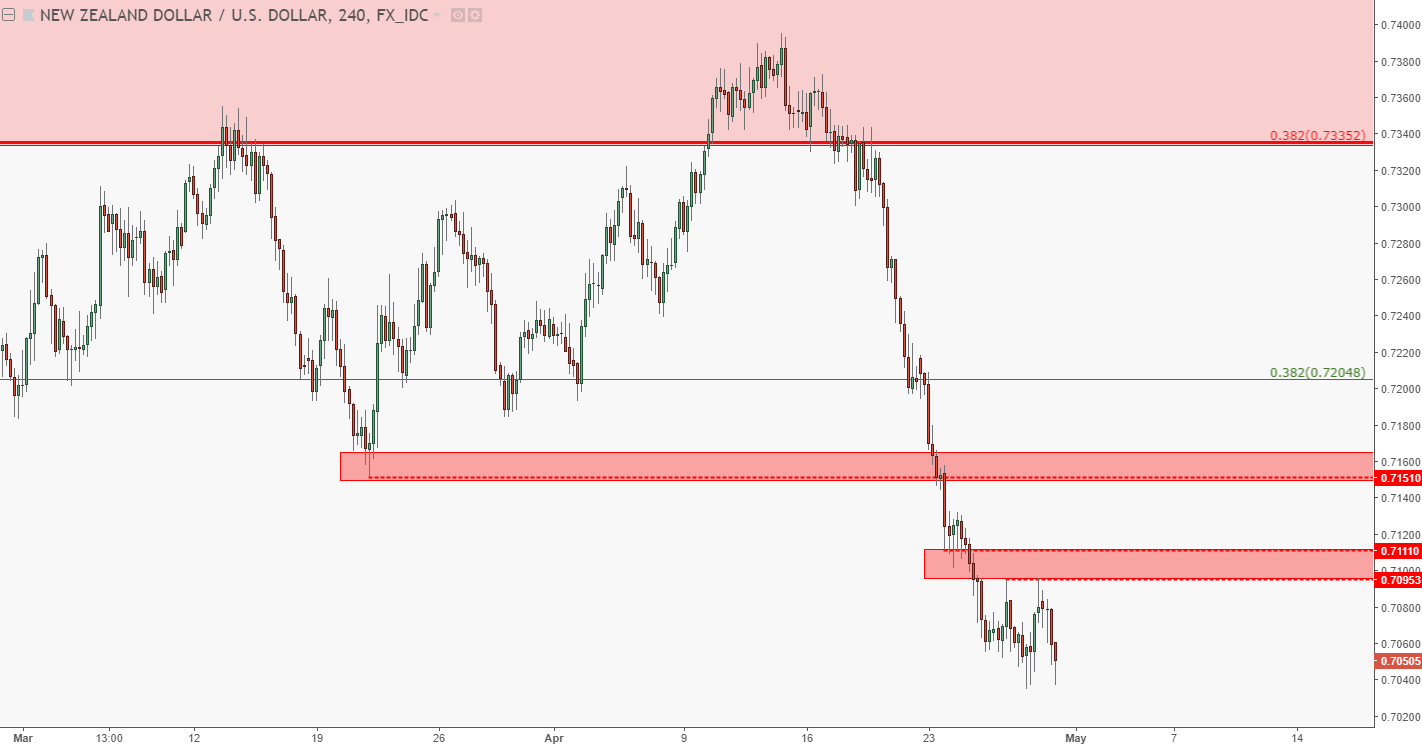
Chart prepared by James Stanley
To read more:
Are you looking for longer-term analysis on the U.S. Dollar? Our DailyFX Forecasts for Q1 have a section for each major currency, and we also offer a plethora of resources on USD-pairs such as EUR/USD, GBP/USD, USD/JPY, AUD/USD. Traders can also stay up with near-term positioning via our IG Client Sentiment Indicator.
Forex Trading Resources
DailyFX offers a plethora of tools, indicators and resources to help traders. For those looking for trading ideas, our IG Client Sentiment shows the positioning of retail traders with actual live trades and positions. Our trading guides bring our DailyFX Quarterly Forecasts and our Top Trading Opportunities; and our real-time news feed has intra-day interactions from the DailyFX team. And if you’re looking for real-time analysis, our DailyFX Webinars offer numerous sessions each week in which you can see how and why we’re looking at what we’re looking at.
If you’re looking for educational information, our New to FX guide is there to help new(er) traders while our Traits of Successful Traders research is built to help sharpen the skill set by focusing on risk and trade management.
--- Written by James Stanley, Strategist for DailyFX.com
To receive James Stanley’s analysis directly via email, please SIGN UP HERE
Contact and follow James on Twitter: @JStanleyFX


