


Talking Points:
- The reversal in the British Pound continues after last week’s March inflation numbers out of the UK. While there is still a possible rate hike on the horizon in a couple weeks at the BoE’s ‘Super Thursday,’ the rest of the year is very much in question as to just how hawkish the BoE might be.
- Sellers remain in-control of near-term price action, and the move in GBP/USD is being driven by both a week British Pound and a strong US Dollar. The longer-term bullish trend that started last year still remains alive; but it may stay on hiatus for a while longer.
- Quarterly Forecasts have just been updated, and the Q2 forecast for GBP/USD is available from the DailyFX Trading Guides Page. If you’re looking to improve your trading approach, check out Traits of Successful Traders. And if you’re looking for an introductory primer to the Forex market, check out our New to FX Guide.
Want to see how retail traders are currently trading GBP/USD? Click here for GBP/USD Sentiment.
GBP/USD: Cable Reversal Continues
Last week saw quite a bit of volatility in the British Pound. The currency was surging-higher from the beginning of April and, to a lesser degree, since the early part of March. Markets were pricing-in the prospect of a hawkish tilt at the Bank of England as inflation continued to run well-above the BoE’s target of 2%. Inflation crossed the 3% marker in 2017, and that continued with the January inflation print out of the UK. But in February, inflation started to slow. Market participants remained cautiously optimistic that that inflation dip might be a one-off or, as former Fed Chair Janet Yellen used to opine, ‘transitory’.
But in March we saw another fall in inflation numbers, and this brought a bit of reality to the trend. Inflation is softening even though we’ve only seen one hike out of the BoE, and this may remove the need for the bank to retain a hawkish stance as we move deeper into the year. While a rate hike at the bank’s next Super Thursday is still very much a possibility, the idea of getting more than one hike in 2018 is considerably less-likely should rates of inflation continue to fall.
That inflation print not only dampened the previously bullish trend, it helped it go into full-on reversal as we’re now trading at fresh monthly lows.
GBP/USD Four-Hour Chart: Bullish Trend Reverses After March Inflation, Leads to Fresh Monthly Lows
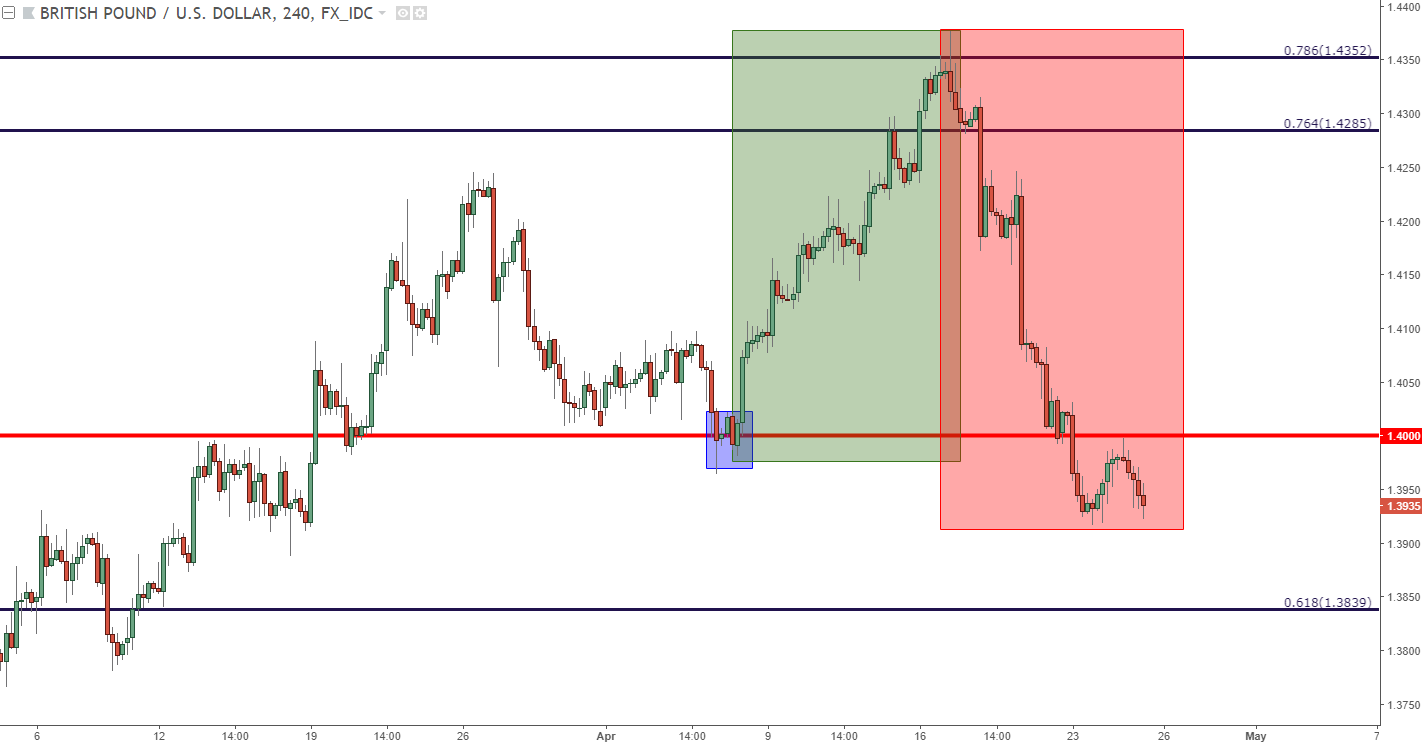
Earlier in the month, we looked at a support setup off of the area around the 1.4000 psychological level, and that setup came into play around Non-Farm Payrolls. That shift of strength in the first couple months of April drove prices up to a fresh post-Brexit high, with resistance eventually showing at the 78.6% Fibonacci retracement of the ‘Brexit move’ in the pair.
But after last week’s reversal prices sank back-below 1.4000, and we’ve seen a bit of resistance show at that area of prior support; leading to the possibility of bearish continuation of this short-term trend. At this point, a break below this morning’s low at 1.3916 would make the prospect of bearish continuation a bit more attractive, leading to an additional bit of confirmation that the 1.4000 high from today will function as the ‘lower high’.
GBP/USD Hourly Chart: Resistance at Prior Support Keeps Open Possibility of Bearish Continuation
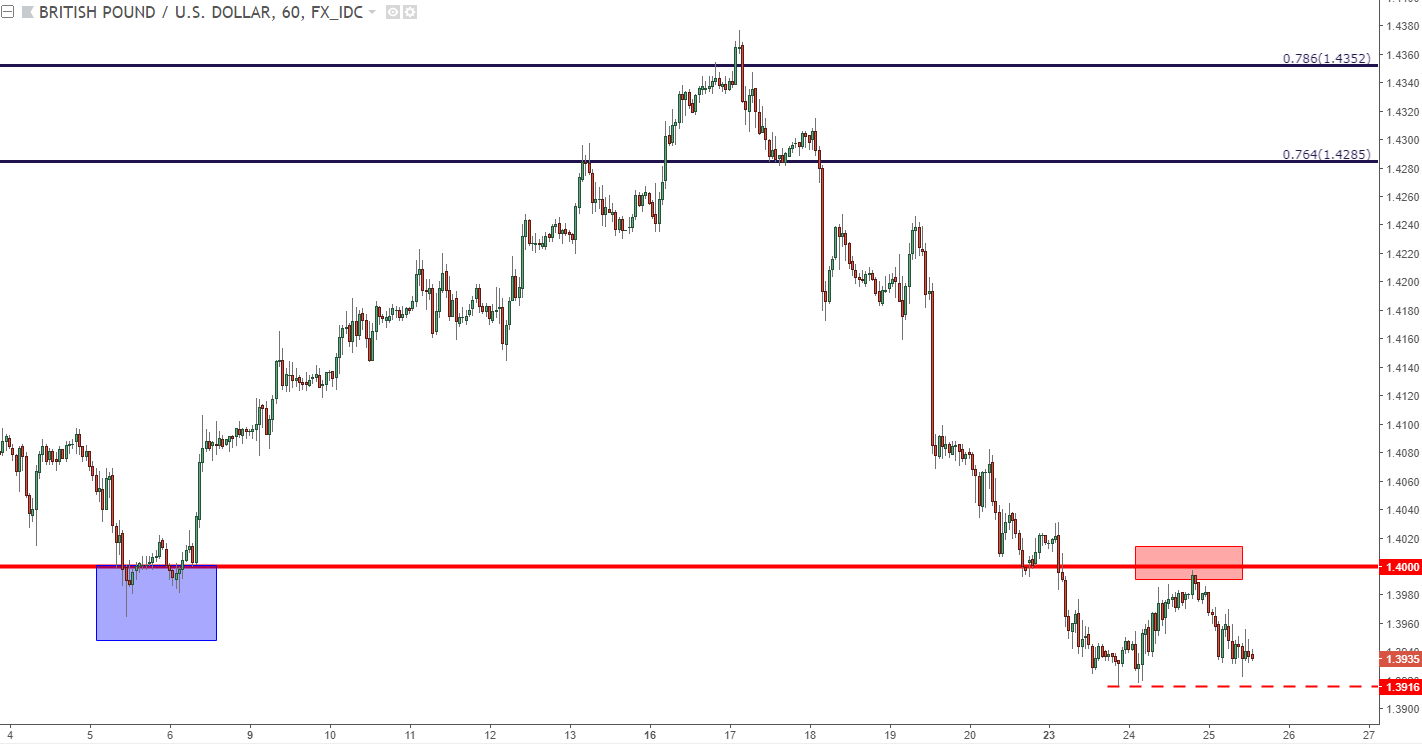
Below current price action are a series of interesting levels for that next stop of support. At 1.3888, we have a swing-low from mid-March, and a bit deeper at 1.3839, we have the 61.8% Fibonacci retracement of the post-Brexit move. If this can’t hold, then prior swing-lows at 1.3780 and 1.3710 are exposed for next possible areas of support.
GBP/USD Four-Hour Chart: Deeper Support Potential

The Bullish View
The bullish view on the pair would currently be driven by patience; letting this retracement run its course until a support area comes into play that could help to re-establish a bullish stance. The topside channel that started last year is still very much alive; but we may need a deeper retracement before that bigger picture trend is ready to resume.
The level around 1.3839 could be especially interesting for this scenario as this is the 61.8% retracement of the same Fibonacci study that helped to mark the high. If we do see some support beginning to show here, the door re-opens to bullish strategies in the pair.
GBP/USD Daily Chart: Support Potential at 61.8% Fibonacci Retracement
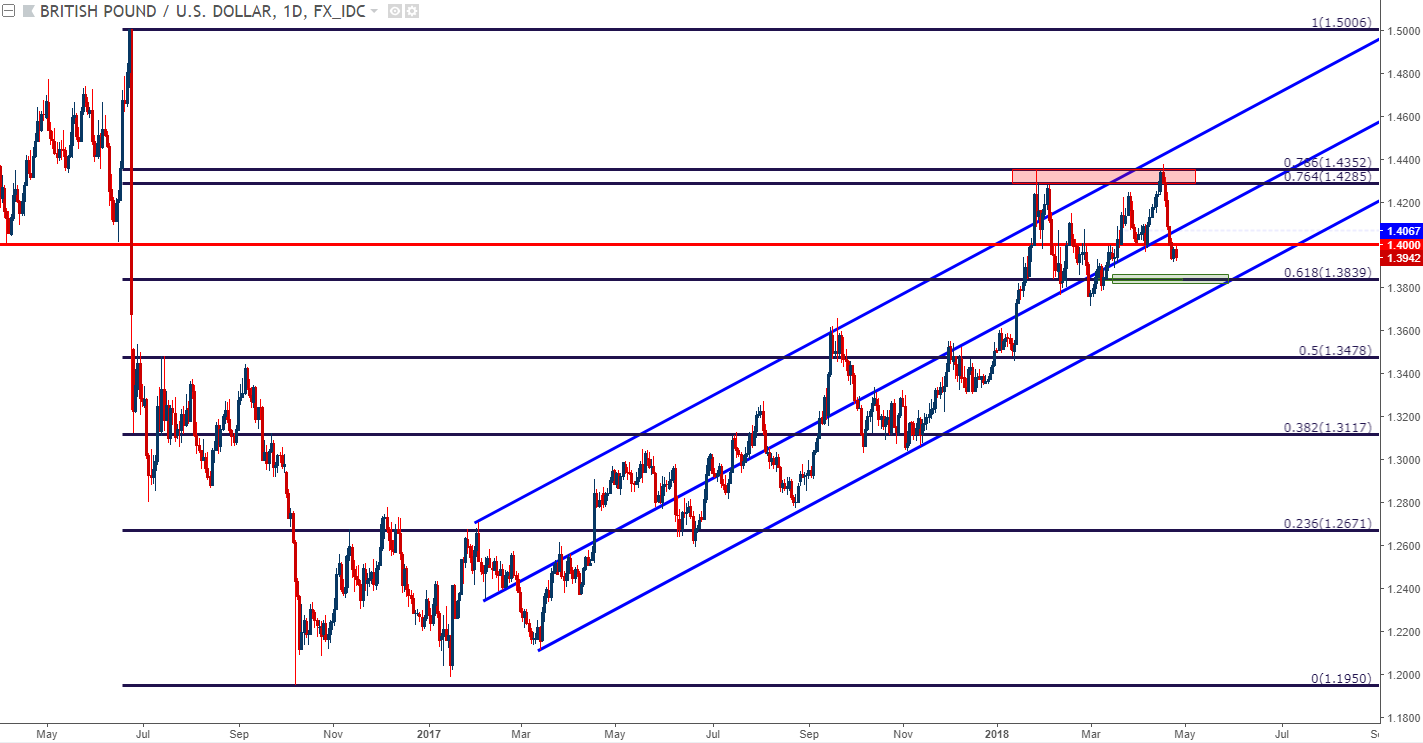
Chart prepared by James Stanley
To read more:
Are you looking for longer-term analysis on the U.S. Dollar? Our DailyFX Forecasts for Q1 have a section for each major currency, and we also offer a plethora of resources on USD-pairs such as EUR/USD, GBP/USD, USD/JPY, AUD/USD. Traders can also stay up with near-term positioning via our IG Client Sentiment Indicator.
Forex Trading Resources
DailyFX offers a plethora of tools, indicators and resources to help traders. For those looking for trading ideas, our IG Client Sentiment shows the positioning of retail traders with actual live trades and positions. Our trading guides bring our DailyFX Quarterly Forecasts and our Top Trading Opportunities; and our real-time news feed has intra-day interactions from the DailyFX team. And if you’re looking for real-time analysis, our DailyFX Webinars offer numerous sessions each week in which you can see how and why we’re looking at what we’re looking at.
If you’re looking for educational information, our New to FX guide is there to help new(er) traders while our Traits of Successful Traders research is built to help sharpen the skill set by focusing on risk and trade management.
--- Written by James Stanley, Strategist for DailyFX.com
To receive James Stanley’s analysis directly via email, please SIGN UP HERE
Contact and follow James on Twitter: @JStanleyFX


