


Talking Points:
- It’s been a big week for the US Dollar and with a loaded calendar next week looks to be the same. USD has gained 3.1% in the past ten days, and this looks to be at least partially-driven by a short-squeeze scenario as rate hike bets get priced further-out in Europe and the UK.
- EUR/USD and GBP/USD have both underwent significant reversals, and are fast approaching support levels of interest. Commodity currencies have been especially friendly to USD-bulls. Next week brings PCE to get a bit of additional inflation data, FOMC is on Wednesday and next week finishes with a bang with the release of April Non-Farm Payroll numbers.
- DailyFX Forecasts have been updated for Q2, and are available from the DailyFX Trading Guides page. If you’re looking to improve your trading approach, check out Traits of Successful Traders. And if you’re looking for an introductory primer to the Forex market, check out our New to FX Guide.
Do you want to see how retail traders are currently trading the US Dollar? Check out our IG Client Sentiment Indicator.
Dollar Strength Continues to Fresh Three-Month Highs
This has been a big week for the US Dollar. After spending most of the past year trending-lower, including a strong bearish drive that continued through January, there weren’t many positive theses for USD-strength. The fact that the down-trend wiped out as much as 15% of the Greenback’s value while the Federal Reserve was one of the only major Central Banks raising rates just made the situation that much more dire. Traders and markets were selling the US Dollar in preference of other currencies out of economies that remain at ‘pedal to the floor’ levels of emergency accommodation. We heard from the ECB yesterday, and they’re not ready to start looking at exiting stimulus, nor does the Bank of Japan appear ready to do so either. And while the Bank of England has actually hiked rates in the past decade, last week’s inflation and this week’s GDP make the idea of additional rate hikes out of the BoE considerably less likely.
The net result has been a jump in the US Dollar; and price action is showing no signs of slowing as the Greenback is still shredding up to fresh three-month-highs after another aggressive extension of the bullish run.
US Dollar Four-Hour Chart: USD Strength Continues to Fresh Three-Month Highs
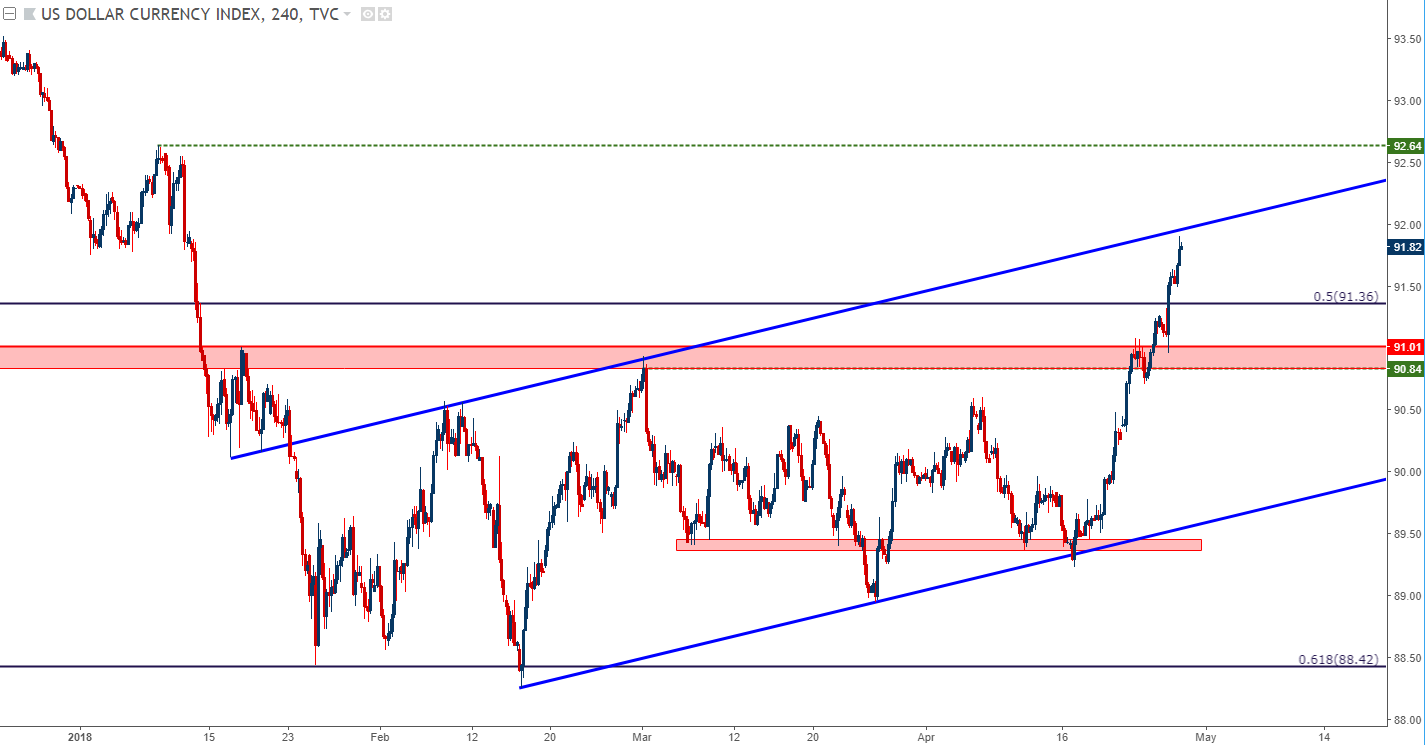
Chart prepared by James Stanley
There is reason to be careful with chasing at current levels: The bullish factor for the US Dollar that finally elicited these topside breaks didn’t come directly from inflation or rate hikes – but rather the deductive dovishness from the ECB and BoE. As rate hike bets got further priced-out of EUR/USD and GBP/USD on the basis of falling inflation leading to an even more passive stance from the representative Central Bank, the US Dollar has finally been freed to fly-higher on the charts. So while there is a somewhat bullish backdrop for the Dollar on the basis of a hawkish Fed, that factor hasn’t changed – and we’re largely in the same spot, fundamentally speaking, as we were this time last week and even the week before that, when the March inflation print was released.
This means that there is a strong chance that much of this two-week run of USD-strength is at least partially coming from a short-squeeze type of scenario: Short USD bets cover as other currency’s fundamental backdrops have dimmed. And while this certainly could continue into a fresh trend of USD-strength, with what we have right now, this move would appear corrective in nature.
US Dollar Daily Chart: Bear Flag Potential in the Longer-Term Move
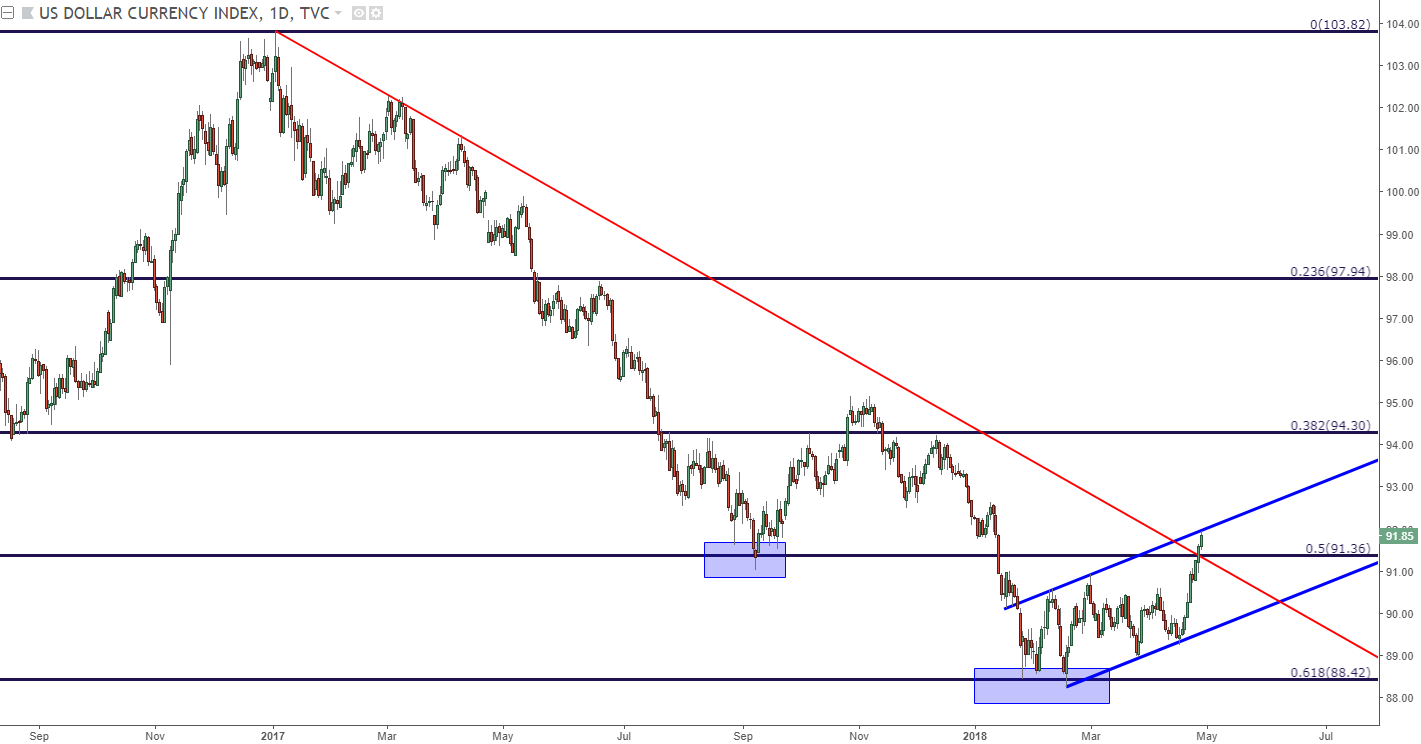
Chart prepared by James Stanley
The US Dollar is in the Spotlight for Next Week
This bullish run in the Dollar will be in the spotlight next week as we have two really big USD items on the calendar along with a few other items of interest. The week opens with another piece of inflation data with the release of March PCE numbers. This is the Fed’s preferred inflation gauge, so do not sleep on this print as this can certainly continue to push the Greenback. On Wednesday, we have the May FOMC rate decision, and on Friday we have non-Farm Payrolls for the month of April.
DailyFX Economic Calendar: USD Items for Week of April 30th

Chart prepared by James Stanley
FOMC: Two or Three More in 2018?
The rate decision will be especially interesting considering the recent jump in inflation. March inflation numbers in the US printed at 2.4%, marking a fresh one-year high; and this comes as inflation is falling in Europe and the UK. Falling inflation across the Atlantic has helped both the BoE and ECB to grow a bit more dovish and passive, and this is likely a key culprit to the US Dollar’s recent two-week breakout.
There are scant expectations for a hike next Wednesday, with current odds hovering at around 6.7%. But June looks far more probable for an adjustment, and next Wednesday is when the Fed can start to lay the groundwork for the rest of the year. This will have to be derived from the statement, however, as there will be no updated projections nor will we get a new dot plot matrix. At the March rate hike, the dot plot matrix indicated that the median expectation at the Fed was for another two hikes to make a total of three interest rate adjustments in 2018. But there was one dot within the matrix that appeared erroneously low, thereby driving down the net and given this recent strength in inflation, odds for a total of four hikes out of the Fed this year are edging-higher. (All interest rate probabilities derived from CME FedWatch)
We’re currently seeing a 46.1% probability of three or more additional hikes out of the Fed in 2018; and that seems to be the current push point for the US Dollar: Whether data is strong enough for another three hikes or whether we’ll be relegated to the previously-expected two.
On a longer-term basis, this week’s USD strength is notable. In Q1 we found support at the 61.8% Fibonacci retracement of the 2014-2017 major move; and after two tests at that support, prices have moved back above the 50% marker. We’re fast approaching a key zone of potential resistance around 92.50. This level had given some rather concerted support last year as a head and shoulders formation built with a neckline around 92.55.
US Dollar Daily Chart: Strength Runs to Prior Neck-Line Support

Chart prepared by James Stanley
Deeper Retracement Potential in EUR/USD, GBP/USD?
A key determinant as to whether or not this two-week run of USD-strength turns into something more will likely emanate from whether or not we see deeper retracements in EUR/USD and GBP/USD. The British Pound takes the stage two weeks from now, when the BoE goes into a ‘Super Thursday’ rate decision that was previously being banked upon for a hike. But – after this morning’s GDP and last week’s inflation, those odds don’t look so strong any longer.
And given this week’s sell-off in GBP, it would appear that the move is not yet done as we’re still pulsing down to fresh lower-lows. GBP/USD has violated almost every support level that we looked at earlier this week, and has still shown no sign of stopping. There is but one level of interest left around 1.3710, as this is the March swing low that’s confluent with the support-side of the bullish channel in the pair.
We looked at a resistance play off of the prior support level of 1.4000 earlier in the week, and prices still have yet to establish any element of support.
GBP/USD Daily Chart: Cable Crushed After 600 Pip Reversal, Prices Approaching March Low

Chart prepared by James Stanley
EUR/USD to 1.2000?
Earlier in the week, we looked at a series of deeper support levels in EUR/USD, and after resistance came-in at a prior area of confluent support, sellers have taken over to push prices down to fresh three-month lows. We’re currently seeing support hold in the ‘s2’ area that we’d looked at around 1.2071-1.2090; but that doesn’t look as though it will hold and a test of 1.2000 may be in short order.
EUR/USD Daily Chart: Prior Psychological Resistance at 1.2000 Exposed as Potential Support

Chart prepared by James Stanley
For a Continuation of USD-Strength, Look to Commodity Currencies
While both of EUR/USD and GBP/USD may have difficulty staging a deeper run of continuation given nearby support structure, the moves that have been seen in commodity currency pairs have been hard to ignore, as USD-strength has been rather visible in most of these pairs.
We’ve been following NZD/USD as a preferred path for USD strength, and we’ve moved near our final target around the .7000 psychological level. Should this theme continue, we may be able to look for a deeper move towards range support, targeting around the .6820-.6870 area on the chart.
NZD/USD Weekly Chart: Deeper Potential Down to Range Support at .6820-.6870
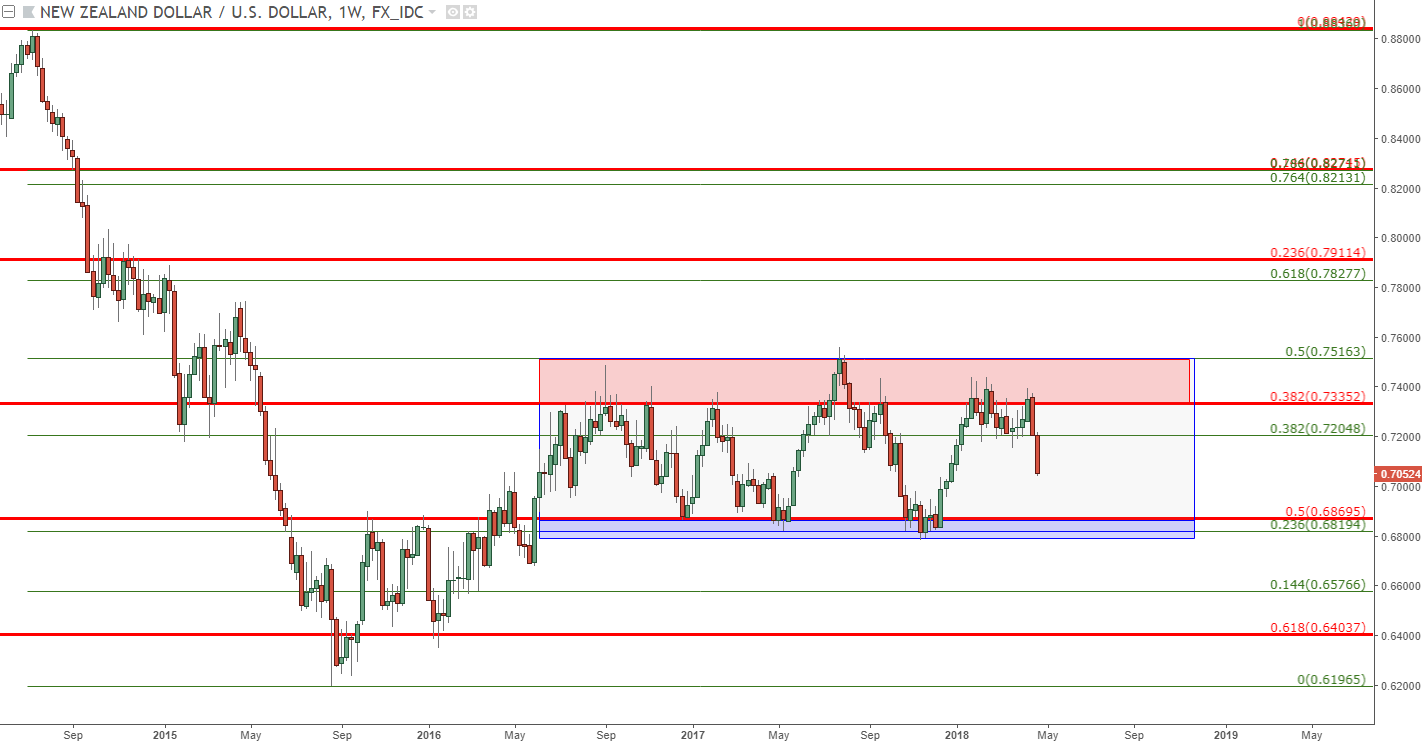
Chart prepared by James Stanley
Also of interest on the side of USD continuation is AUD/USD. AUD/USD broke below a two-year trend-line earlier this week, and prices are now finding a bit of support at the 61.8% Fibonacci retracement of the 2017-2018 major move.
AUD/USD Daily Chart: Major Trend-Line Break Runs Down to Fibonacci Support
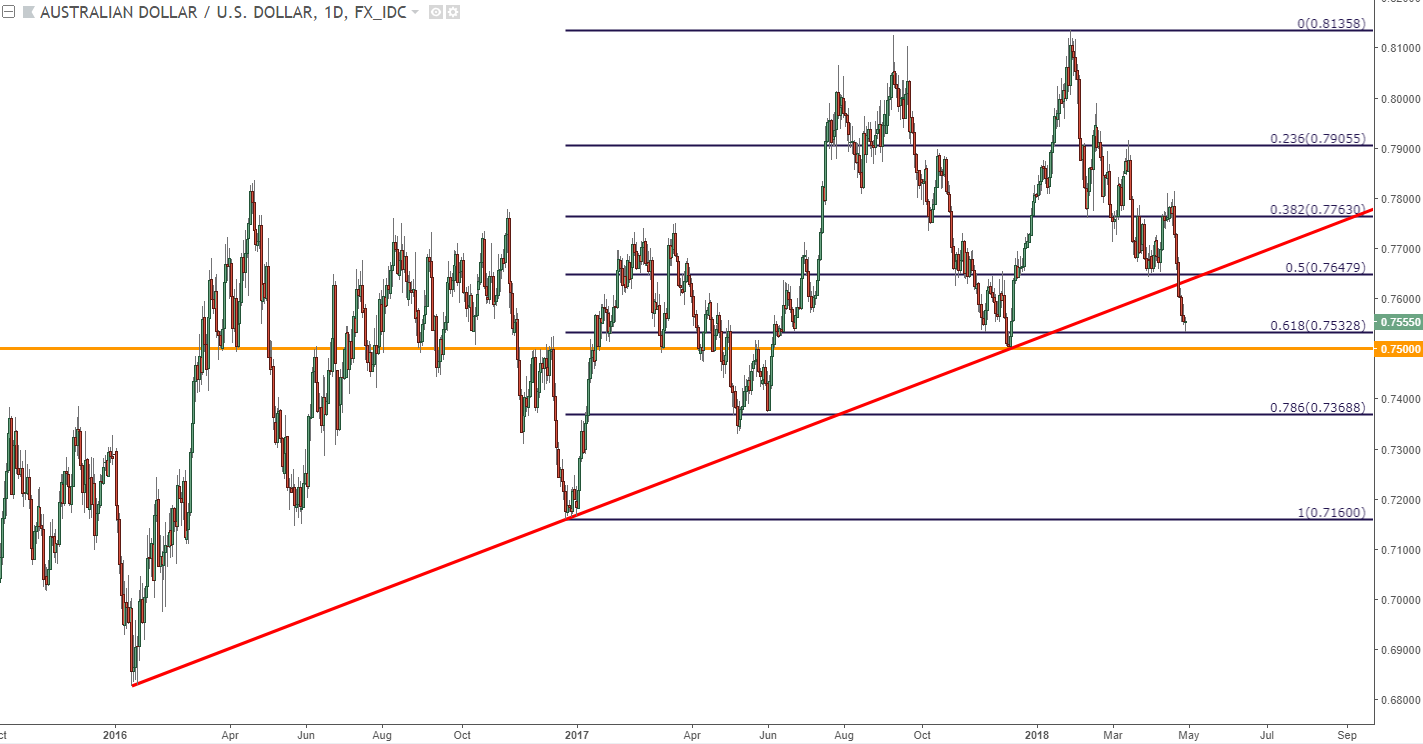
Chart prepared by James Stanley
This Fibonacci support in AUD/USD can actually be helpful for playing a continuation of USD-strength, as a pullback in this oversold near-term move can allow for resistance to come into play. On the hourly chart below, we’re looking at a couple areas of interest for lower-high resistance in AUD/USD.
AUD/USD Hourly Chart: Lower-High Resistance Potential for Bearish AUD/USD Continuation

Chart prepared by James Stanley
To read more:
Are you looking for longer-term analysis on the U.S. Dollar? Our DailyFX Forecasts for Q1 have a section for each major currency, and we also offer a plethora of resources on USD-pairs such as EUR/USD, GBP/USD, USD/JPY, AUD/USD. Traders can also stay up with near-term positioning via our IG Client Sentiment Indicator.
Forex Trading Resources
DailyFX offers a plethora of tools, indicators and resources to help traders. For those looking for trading ideas, our IG Client Sentiment shows the positioning of retail traders with actual live trades and positions. Our trading guides bring our DailyFX Quarterly Forecasts and our Top Trading Opportunities; and our real-time news feed has intra-day interactions from the DailyFX team. And if you’re looking for real-time analysis, our DailyFX Webinars offer numerous sessions each week in which you can see how and why we’re looking at what we’re looking at.
If you’re looking for educational information, our New to FX guide is there to help new(er) traders while our Traits of Successful Traders research is built to help sharpen the skill set by focusing on risk and trade management.
--- Written by James Stanley, Strategist for DailyFX.com
To receive James Stanley’s analysis directly via email, please SIGN UP HERE
Contact and follow James on Twitter: @JStanleyFX


