


Talking Points:
- This morning’s NFP report produced an interesting move: A quick hit of USD weakness after the NFP print was quickly faded out of markets, with USD now positive on the day.
- This helped produce a spike in EUR/USD up to a Fibonacci level that quickly brought sellers into the market. This puts the pair in a fairly interesting position ahead of next week’s ECB meeting.
- IG Client Sentiment remains elevated in EUR/USD, with a current read of -2.05 while GBP/USD is currently showing -1.08.
- Want to see how Euro, GBP and USD have held up to the DailyFX Q3 Forecasts? Click here for full access.
To receive James Stanley’s Analysis directly via email, please sign up here.
This morning’s NFP report was not without fireworks. After a disappointing print of +156k versus the expectation of +180k, USD weakness took over as prices in DXY burst-lower. But within five minutes of that print being released, support began to show and prices began to wiggle higher until we moved back-above the pre-NFP level. Meaning the entirety of the NFP sell-off had already been erased within 25 minutes of the data being released. This leaves the U.S. Dollar in a rather precarious position, as we’re sitting on the 50% Fibonacci retracement of this week’s bullish move; but the fact that sellers couldn’t hold the move is noteworthy as it is yet another piece of evidence that USD may be trying to carve out a near-term bottom (discussed further below).
U.S. Dollar via ‘DXY’ Hourly: post-NFP reversal (in shaded blue), Support at 50% Fib
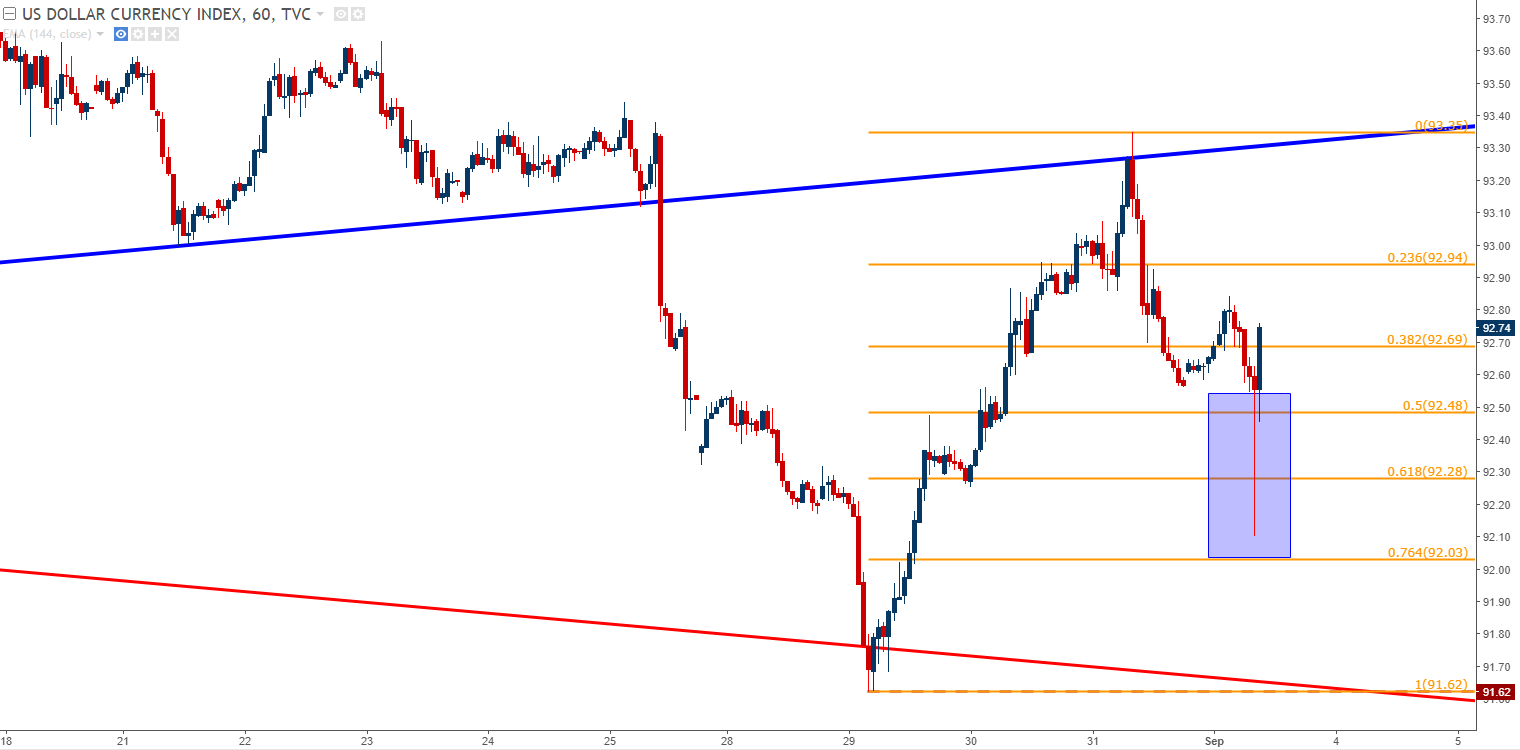
Chart prepared by James Stanley
This, of course, played out in EUR/USD, as well. The pair popped-higher on the initial print, at which point resistance began to show around the 23.6% Fibonacci retracement of the most recent bullish move at 1.1974. Then a report was being circulated indicating that the ECB may be trying to kick the can on stimulus exit until their December meeting, which may have helped provide an additional token of weakness to the single currency. Whatever the impact of that report or rumor, the result was a complete fade of that bullish move post-NFP, and EUR/USD is now trading below the 38.2% level from that same Fibonacci retracement.
EUR/USD Hourly: NFP Fade (in Red) Exposes Support Zone 1.1817-1.1866

Chart prepared by James Stanley
Next Week is Huge for the Euro
Next week brings a pivotal ECB meeting in which the bank is expected to make some type of statement regarding their stance with QE. The current program is set to expire in December, and next Thursday is the last set of projections that the ECB will release until that December rate decision; so logically, many are expecting some element of clarity around what the bank wants to do before the program actually completes.
The rumor circulating earlier this morning further highlights that they might try to avoid that. Doing so would be waving the proverbial red flag in front of traders and markets to load-up on long Euro positions in anticipation of higher rates. This demand, of course, can create a stronger Euro with EUR/USD likely moving above the 1.2500 level in such a scenario, or perhaps even 1.3000, and this itself can become a hindrance to an ECB that’s managed a fledgling economy with lackluster inflation for the better part of the past nine years.
Thursday morning brings a European Central Bank meeting that will likely be watched across global markets for any clues that could indicate the bank’s next steps. The big question is whether the ECB has anything in their arsenal that can deter the ramped-up demand from buyers expecting a move towards a ‘less loose’ stance, whether that be in September or December. Mr. Draghi has been trying to temper this theme throughout the year, repeatedly saying that the ECB hadn’t even discussed the prospect of stimulus exit, but this has had a diminishing marginal impact on the single currency. In April and June, those denials led to a couple weeks of softness. But in July, that same denial was met with buyers as markets were fading what Mr. Draghi was saying. Then at his speech at Jackson Hole last Friday, his clear avoidance of monetary policy was deductively read to be bullish the Euro as the single currency popped-up to a fresh 2.5 year high ahead of the close.
If the ECB is able to successfully kick the can on stimulus exit until their next meeting in December, will this reverse the bullish 2017 trend in EUR/USD? Probably not, at least not on its own. But, it may bring on a support test around that meeting, and there’s a longer-term zone that we’ve been following that could be very interesting for such a scenario, shown below:
EUR/USD Four-Hour: Deeper Support Zone Between 1.1685-1.1736

Chart prepared by James Stanley
While much of the world will likely be watching EUR/USD next week, there’s another interesting theme brewing across FX markets. The U.S. Dollar has moved down by as much as -11.75% so far this year from the high set on just the second trading day of 2017 down to this week’s fresh 2.5 year low. Evidence has started to show that sellers may be running out of steam, and later in the month of September brings a pivotal FOMC rate decision in which the bank is expected to roll out balance sheet reduction. The Dollar was showing signs of trying to carve out a bottom through much of August, but broke-lower after those Jackson Hole speeches last Friday, and continued-lower after North Korea launched a missile over Hokkaido, Japan; further stoking risk aversion.
U.S. Dollar via ‘DXY’ Daily: Fresh 2.5 Year Low Set Earlier in the Week, Churn Near Support
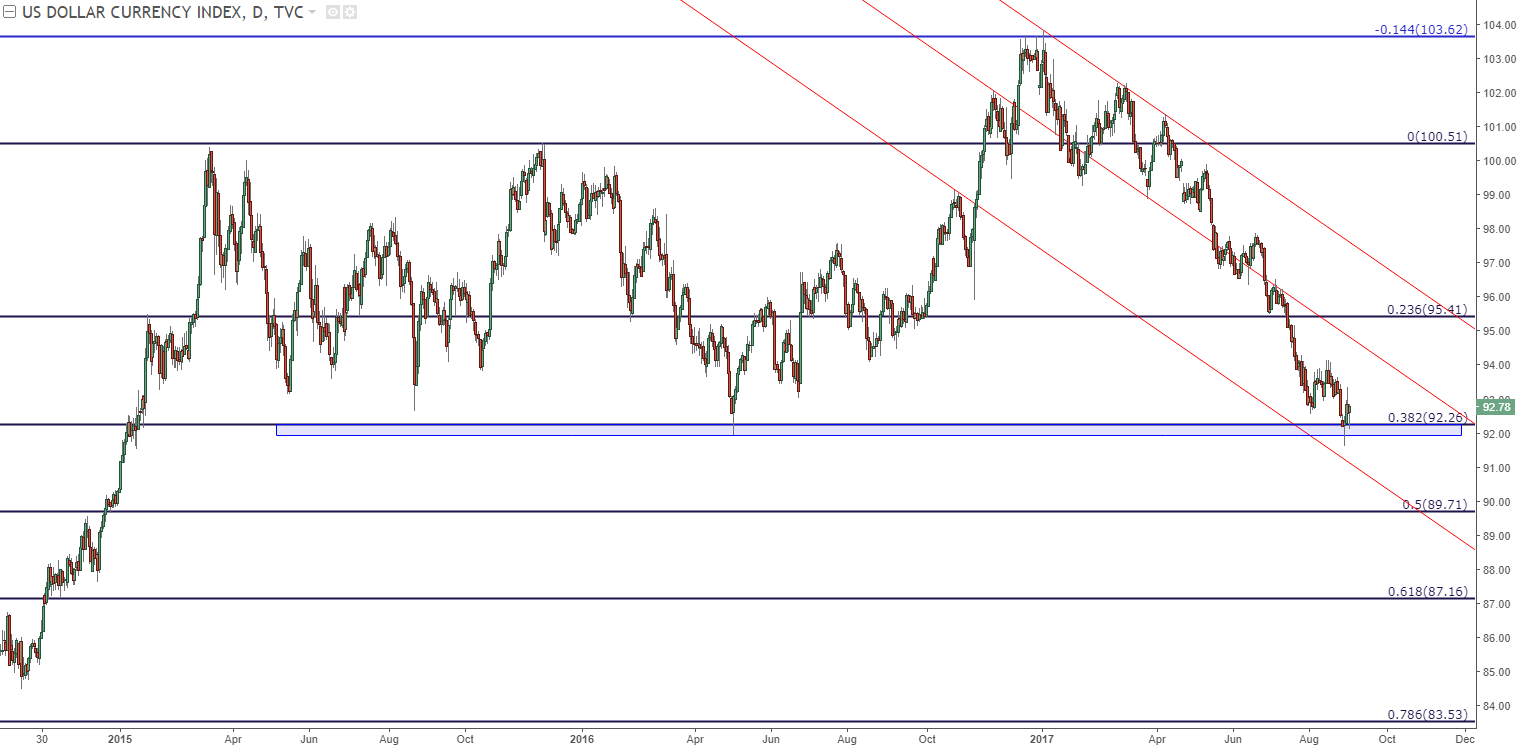
Chart prepared by James Stanley
But after setting that fresh 2.5 year low on Monday/Tuesday, the Dollar began screaming higher in a move that did not look to be entirely based on short-cover. Prices ran into the under-side of a bullish trend-line that had showed up in August, and now we’re seeing support at the 50% level of that bullish move after this morning’s NFP fade. If Mr. Draghi is able to successfully quell strength in the single currency at next week’s ECB meeting, we could be in store for some bullish price action in the U.S. Dollar after a brutal first eight months of 2017. On the four-hour chart below, we’re looking at three resistance levels that traders can use to further confirm a bullish move in the U.S. Dollar in order to steer directional stances around the Greenback.
U.S. Dollar, ‘DXY’ Four-Hour Chart: Resistance Levels Applied
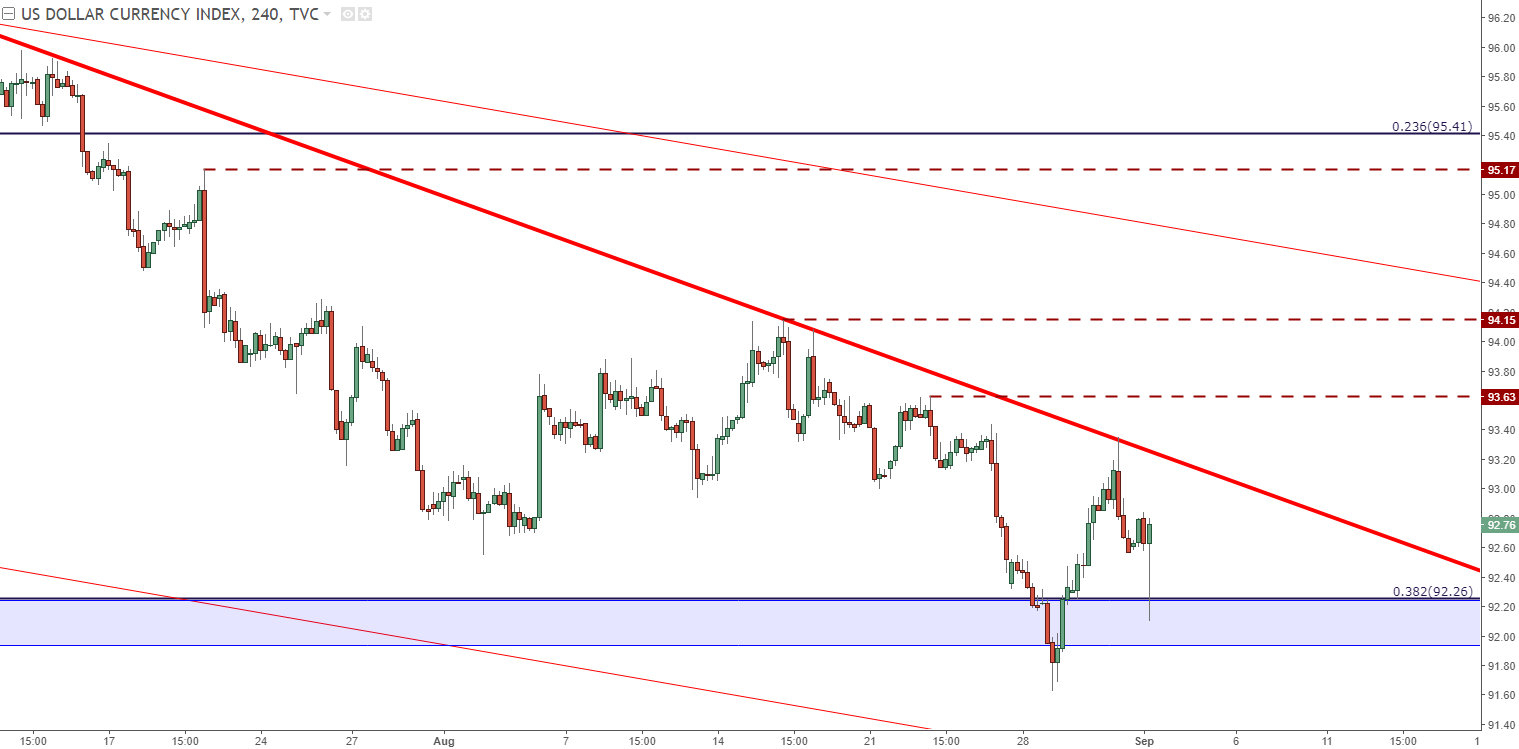
Chart prepared by James Stanley
--- Written by James Stanley, Strategist for DailyFX.com
To receive James Stanley’s analysis directly via email, please SIGN UP HERE
Contact and follow James on Twitter: @JStanleyFX


