


Talking Points:
- Dollar weakness is showing despite the fact that this week brings few USD macro drivers. There are no high-impact USD releases on the calendar, and the Federal Reserve is in the ‘quiet period’ ahead of their next rate decision.
- EUR/USD is breaking out to fresh 14-month highs ahead of Thursday’s ECB rate decision.
- If you’re looking for trade ideas, please check out our Trading Guides. And if you’re looking for shorter-term trade ideas, please check out our IG Client Sentiment.
To receive James Stanley’s Analysis directly via email, please sign up here.
While this week does contain the potential for some fireworks, few were probably expecting matters to develop so quickly ahead of the European Central Bank rate decision on Thursday. Starting at about 9PM ET yesterday, EUR/USD began to breakout to the upside, again, and the move hasn’t yet stopped. This breakout has cleared above the psychologically-important 1.1500 level, as well as the bullish trend channel that’s defined EUR/USD price action for much of 2017.
EUR/USD Hourly Chart – Emphasis on Bullish Breakout Beyond 1.1500-level

Chart prepared by James Stanley
This breakout has pushed EUR/USD into territory that hasn’t been seen for over 14 months, and even then – those prior swings were rather fleeting as sellers had quickly taken-over to re-drive prices back-down towards lows. But, this area does offer a couple of swings that could be usable as potential resistance, specifically for profit targets on bullish approaches; or perhaps even as short-term resistance to lead-in to a long re-entry setup. The level at 1.1615 is the last profit target for our Analyst Pick setup on Long EUR/USD earlier in July. Just beyond this area, we also have a swing at 1.1714 that could be setup as a potential resistance level.
EUR/USD Daily – Prior Price Action Swings as Potential Resistance Levels
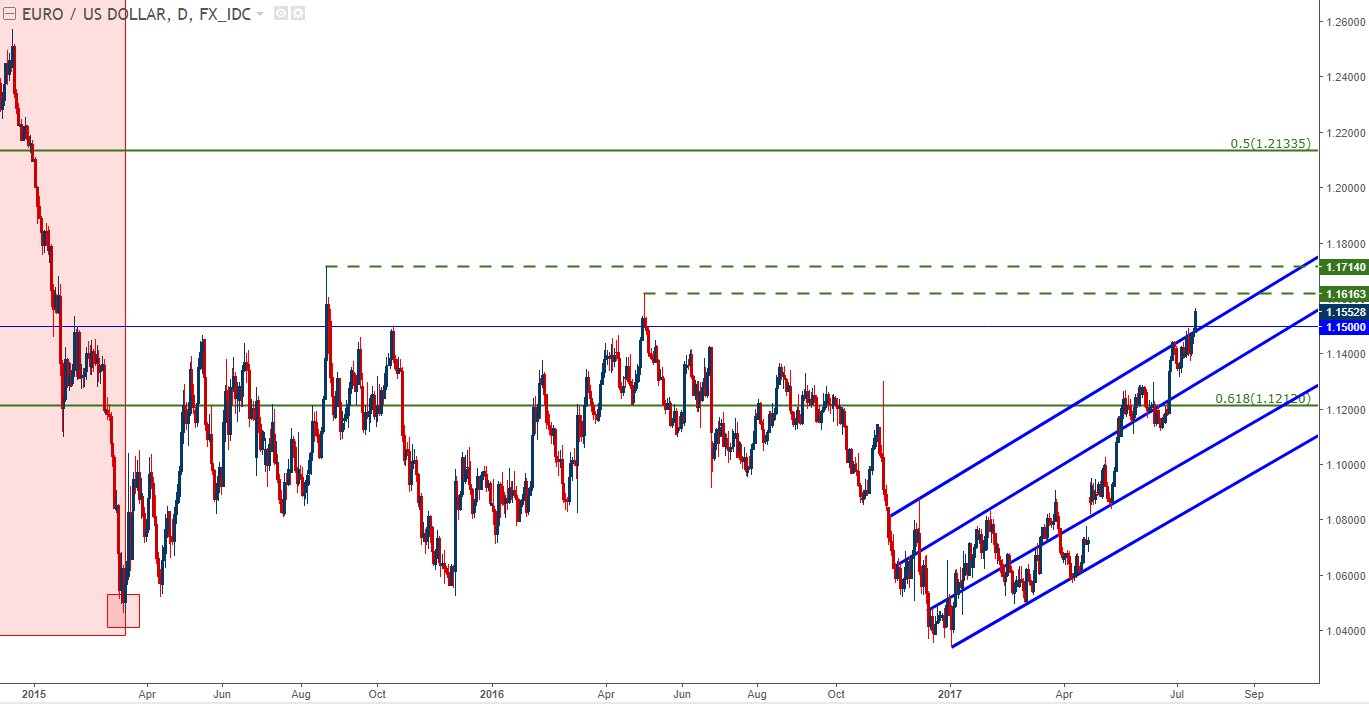
Chart prepared by James Stanley
Pound Break-Down
On the other side of the coin, the British Pound has been selling-off this morning after inflation came-in below expectations. Inflation for the month of June in the U.K. printed at 2.6%, well-below the 2.9% print in May that had sent pulses racing under the premise that the BoE may be looking at rate hikes sooner-rather-than-later. With June inflation coming-in a bit less aggressive, this may remove some pressure from the prospect of higher rates in the U.K., and correspondingly the British Pound has sold-off on the news.
The bigger question is whether bulls will come-in to support the move under the expectation that inflation will continue to remain brisk. With price pressures still running above the BoE’s 2% target, and given that this is a trend that’s been taking place longer than the past month with inflation running above the bank’s target, and we likely haven’t heard the last of this story yet.
Yesterday’s bullish run in Cable brought prices all the way above the 1.3100 psychological level, which was the first exit target from our Analyst Pick set up last week. Price action in Cable is in the process of making a run on the 1.3000 psychological level, which is confluent with the 23.6% Fibonacci retracement of the most recent bullish move. A bit-lower, at 1.2920 and 1.2857 we have a couple of additional potential support levels that can be gleamed from that Fibonacci retracement, and either of these could be incorporated for bullish continuation strategies.
GBP/USD Hourly with Potential Support Levels Applied
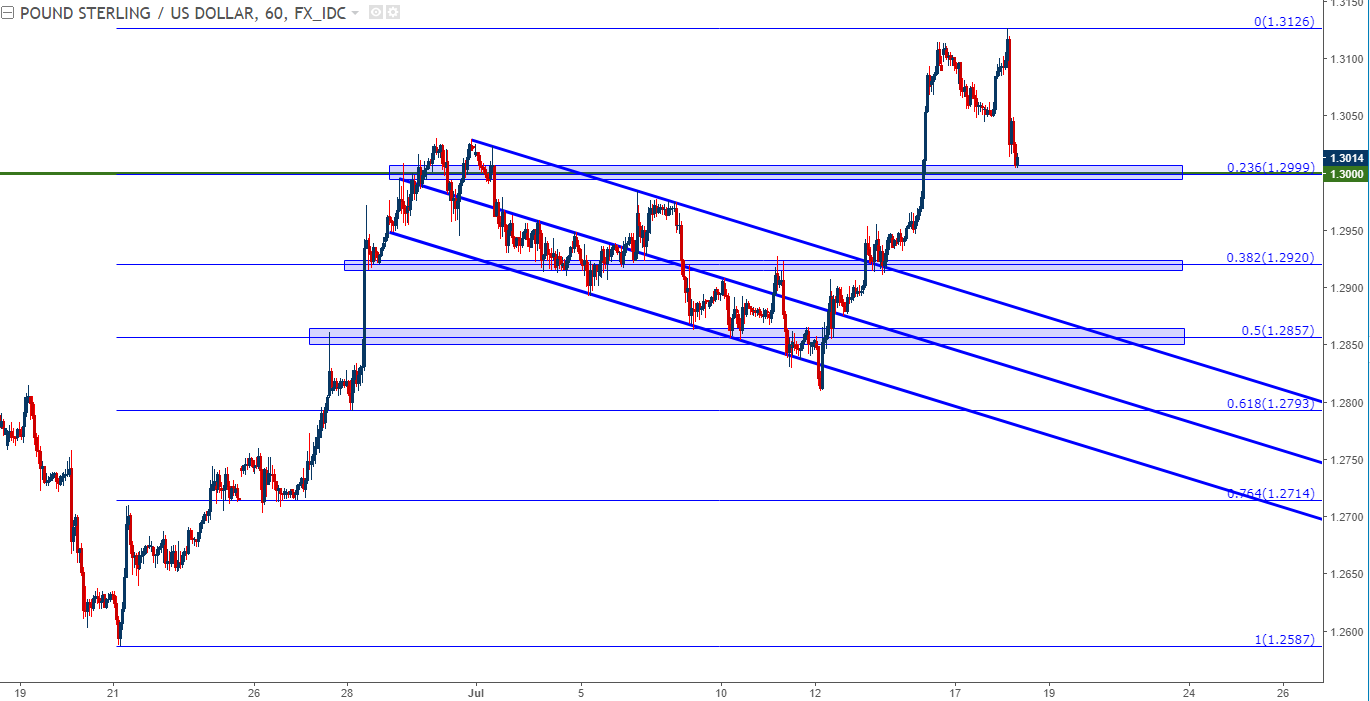
Chart prepared by James Stanley
Dollar Weakness Continues to Fresh Lows
Also breaking-below a big psychological level this morning is the U.S. Dollar. ‘DXY’ has broken below the 95-level, which hasn’t been seen since September of last year. As we covered in the quarterly forecast for the Greenback, a break of support at 95.86 opened the door to tests of deeper, longer-term levels around 94 and 93. What I was not expecting in that forecast, however, was for the bulk of the move to show up in the first couple weeks of the quarter…
At this stage, the Dollar remains extremely weak after an attempt to carve-out short-term support failed yesterday. Taking prior price action, there are potential support levels around 94.08 and 93.02, as these levels were the August 2016 and June 2016 swing-lows, respectively. If these supports can’t hold up, the 2016 low at 91.92 is exposed, and if this is broken, then the Fibonacci level around 90 becomes interesting for a ‘blow-off’ move of USD-weakness.
U.S. Dollar Weakness (via ‘DXY’) – Emphasis on longer-term support swings

Chart prepared by James Stanley
--- Written by James Stanley, Strategist for DailyFX.com
To receive James Stanley’s analysis directly via email, please SIGN UP HERE
Contact and follow James on Twitter: @JStanleyFX


