


Talking Points:
- The ‘risk on’ trade received a shot-in-the-arm yesterday around a key phrase in Chair Yellen’s Monetary Policy Report to the Congress.
- This has created more USD-weakness as another fresh 10-month low printed this morning, and this can potentially drive further flows into the theme of Yen weakness.
- Q3 Forecasts have just been released and are available in our Trading Guides. And if you’re looking for something more interactive in nature, please check out our DailyFX Live webinars.
To receive James Stanley’s Analysis directly via email, please sign up here.
The first day of the Federal Reserve’s Humphrey-Hawkins testimony appears to have been well-received, at least by equity markets. During yesterday’s testimony, Chair Yellen reiterated that the bank is continuing to look to tighten policy while also preparing to start reducing the balance sheet by the end of this year.
What might not have been expected, and what may have driven bulls across the equity space was the last paragraph contained in the Monetary Policy Report to the Congress. After much of the report offered an upbeat tone towards forward-looking economic conditions, the last paragraph echoed what has become known as the ‘Fed Put’. The Fed Put is the idea that the Federal Reserve can re-ignite stimulus in the event that equity market declines became too worrisome. This is like a sense of support for equity market participants, as this seemingly attempts to rule out the possibility of another financial collapse.
The exact line in the Fed’s Monetary Policy Report to the Congress is as follows:
“However, the Committee would be prepared to resume reinvestments if a material deterioration in the economic outlook were to warrant a sizable reduction in the federal funds rate. More generally, the Committee would be prepared to use its full range of tools, including altering the size and composition of its balance sheet, if future economic conditions were to warrant a more accommodative monetary policy than can be achieved solely by reducing the federal funds rate.’
So, Chair Yellen basically said ‘we’re going to continue to tighten policy, but if things break, we’ll jump back in with more QE, using as much size and force as necessary to quell the issue.’ This basically functions like a put option for the Federal Reserve, and this isn’t the first time that this has happened. Alan Greenspan used similar policy maneuvering as he would normally reduce interest rates in response to equity market declines of 20% or more. This became known as the ‘Greenspan put’, and he used it after the 1987 S&L crash. Many point fingers at the ‘Greenspan put’ being at least partially responsible for the dot-com crash in the year 2000.
So the idea of a ‘Fed put’ went away for a few years, and then in 2007-2008, we had another version of this theme with the ‘Bernanke put’. This would take place when former Fed Chair Ben Bernanke would aggressively lower interest rates to fight stock market declines during the financial collapse. For much of the nine years since, equity markets have had the sense of support that, should matters go awry, the Federal Reserve would be right back to the party to furnish the punch bowl with fresh liquidity. This is another form of the ‘Fed put’, and this could seemingly help to retain support in equity markets as there is the constant threat of the Fed coming in to provide more liquidity.
The net response to yesterday’s statement and testimony was another burst-lower in the U.S. Dollar, with price action resisting off of our 95.86 Fibonacci level; along with burst-higher in stock prices as the S&P 500 moved back towards all-time highs.
S&P Four-Hour Chart, Support Holds at 2404, bullish break of bearish trend-line
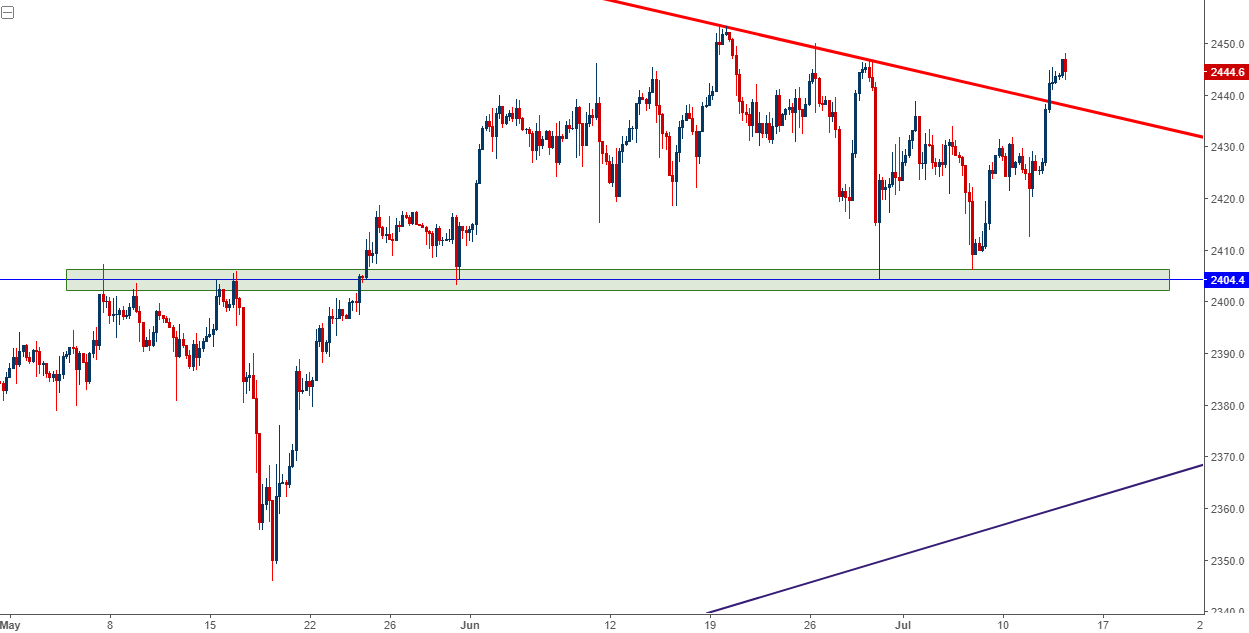
Chart prepared by James Stanley
In the currency space, the U.S. Dollar posed another leg of weakness as the 2017 bearish channel continued. Price action in DXY tip-toed down to a fresh 10-month low earlier this morning, but sellers dried up as we encroached on new territory. As prices rose to re-test the under-side of 95.86, sellers came back-in, giving the appearance of bearish continuation in the Greenback. Below, we’re looking at the longer-term setup with emphasis on a key support/resistance level of 95.86.
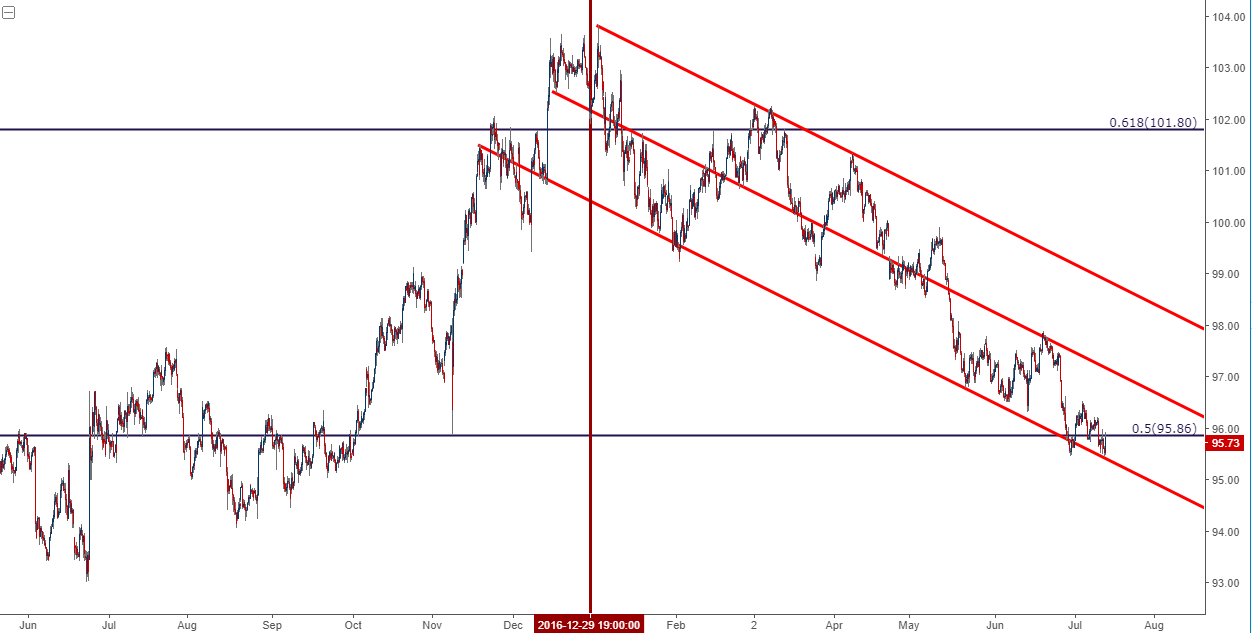
Chart prepared by James Stanley
What Could the ‘Fed Put’ Mean for Forex Markets?
If we do see a continuation of risk assumption, this could mean bright spots for the themes of Japanese Yen weakness, and strength in the Euro and British Pound as growth and inflation dynamics continue to develop. As our own Christopher Vecchio pointed out earlier this morning, risk appetite is surging as commodity currencies paired up with the Yen are testing fresh highs in pairs like AUD/JPY or CAD/JPY.
EUR/JPY could be particularly interesting for this type of theme, and we’ve already seen a rather interesting reaction this morning. This pair has spent a large portion of Q2 being in some form of an overbought state. After the first round of French elections resolved with a rather market-friendly outcome, the themes of Euro strength and Yen weakness took-off, and offered very little pullback in the bullish move.
The pair catapulted up to fresh 17-month highs on Tuesday, and since then has seen a bit of retracement to bring prices back to a key support level of 128.52. This is the 38.2% retracement of the ‘Abenomics’ move and since this level has come into play earlier this morning, bulls have taken-over price action.
EUR/JPY Support Response at 128.52

Chart prepared by James Stanley
Another interesting area for traders to investigate behind this theme is GBP/JPY. The theme of strength in the British Pound is a bit newer than what we’ve seen in the Euro, as this recent story didn’t really start until mid-June. But given how incredibly weak the Japanese Yen has been, GBP/JPY has been showing bullish price action for over a month now.
Yesterday produced a support test of 145.25, and since then we’ve seen bulls return to drive prices back-towards prior highs.
GBP/JPY four-hour chart, Support Response to Zone around 145.25
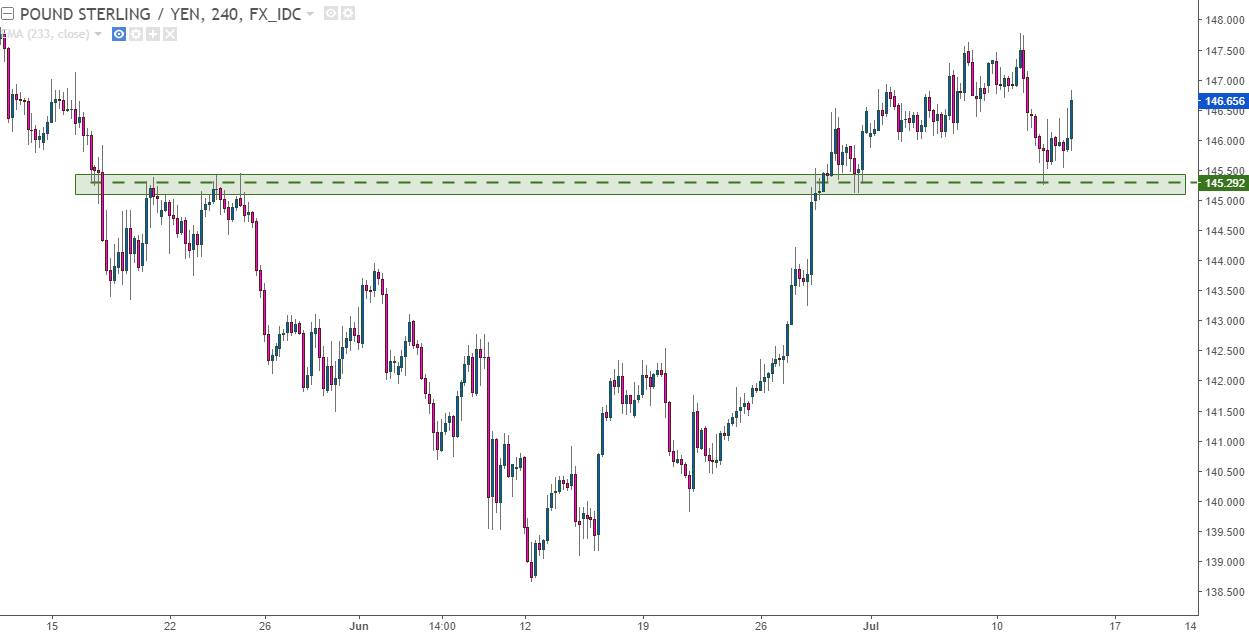
Chart prepared by James Stanley
An analyst pick was issued for synthetic GBP/JPY exposure earlier this morning, using long GBP/USD and long USD/JPY to get exposure to this theme but with a bit more control on either side of the setup.
--- Written by James Stanley, Strategist for DailyFX.com
To receive James Stanley’s analysis directly via email, please SIGN UP HERE
Contact and follow James on Twitter: @JStanleyFX


