


Talking Points:
- It’s been a heavy week of data. The big takeaway has been even more USD-weakness; and with NFP on the docket for next Friday, we’re not likely done with USD-volatility in the near-term.
- We look at two markets below in EUR/USD and Gold that traders can look to in order to focus upon this theme of continued USD-weakness.
- If you’re looking for trading ideas, check out our Trading Guides. And if you want something more short-term in nature, check out our SSI indicator.
It’s been a huge week of data. The announcement that many were looking for to get some volatility in the US Dollar produced little (Wednesday’s FOMC announcement); and the announcement that many were afraid of actually brought no additional information but produced some outsized moves anyways (the Bank of Japan’s hold to policy at their Thursday meeting), and the data point that many already had low expectations for came in even lower than feared (US GDP).
Add to that a dizzying set of corporate earnings with a strong frame of fear coming out of Apple’s earnings highlighting the risk of ‘macro headwinds’ while both Facebook and Amazon came in well-above expectations. With so much news in the environment, it can be difficult to deduce which themes or data points produced which moves; so in today’s Market Talk, we’re going to look at two of the more pronounced themes to have come from this week’s price action, along with what to watch for in the week ahead, in which high-importance US Data is to be delivered on Monday, Wednesday and Friday (NFP).
USD Weakness
Probably one of the more pronounced moves from this week came out of the Greenback, and this was likely more driven by that anemic GDP figure rather than FOMC or any other single factor. Wednesday’s FOMC statement helped to drive USD up to near-term resistance. But the statement lacked any concerted language about what the bank might do in June, and seemingly, this statement merely left the door open for a hike without putting the bank in a committed-stance.
But Thursday’s GDP disappointment brought the Dollar lower to support, and this morning’s follow-thru price action has staged a break through that as USD sits at a 10-month low.
We had looked at a Fibonacci retracement on the US Dollar two weeks ago after the dollar had set a new short-term low, and those levels played out well. We’ve updated the chart below with recent price action to look at how this might be approached in the weeks ahead.
As we said two weeks ago, be careful of chasing a down-trend while we’re so near support (or chasing an up-trend whilst at or near resistance). The same confluent level of support that we discussed in that last article can be used to look for new resistance now that new lows have come into play. Traders can look for resistance to develop at the 11,836-11,837 region next week to look for resumption plays in the US Dollar.
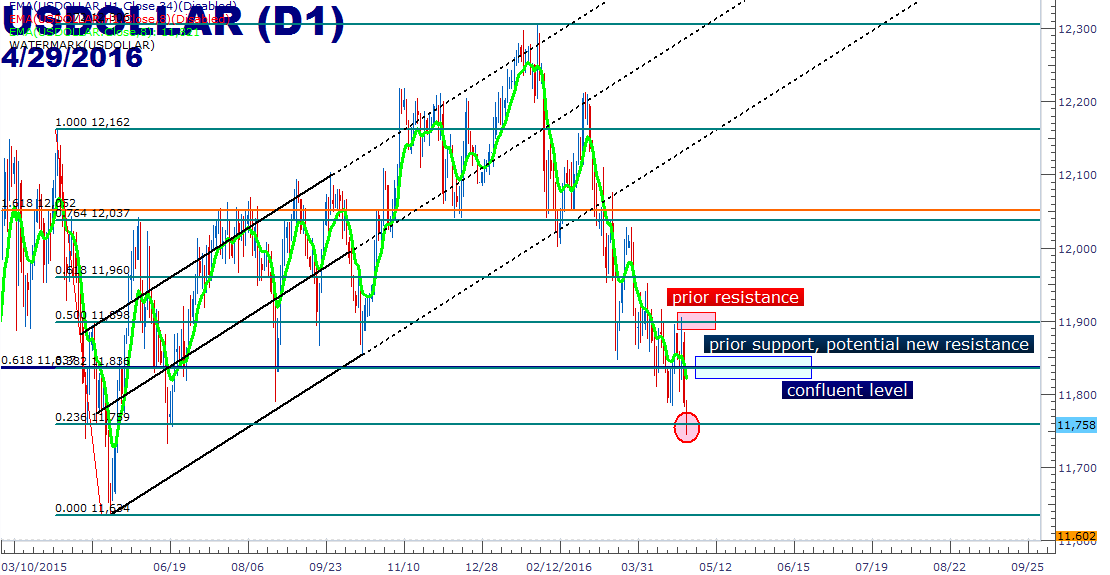
Created with Marketscope/Trading Station II; prepared by James Stanley
EUR/USD Just Broke out of a Bull Flag Formation
As usual, this exuberantly weak US Dollar has produced reverberations throughout the currency world. EUR/USD has staged an extremely strong weak, with a bounce off of the Fibonacci support level that we had outlined last Friday in the article, EUR/USD and USD/JPY Setups Ahead of a Heavy Week of News. The level of interest that we had outlined came in as support early this week, and the drop in the US Dollar took care of the rest.
The current issue with the setup in EUR/USD is that we’ve run up to a really well-tested and fairly well-defined level of resistance that capped the pair’s advance throughout the month of April. Just as we mentioned on the US Dollar, be careful of chasing these types of moves. The level of interest currently showing resistance is the 23.6% retracement of the most recent major move in the pair (shown below) at 1.1417. Traders can look for EUR/USD to pullback, looking for support from the 1.1291-1.1350 (outlined with a green box below) neighborhood before investigating top-side re-entries.

Created with Marketscope/Trading Station II; prepared by James Stanley
Gold is Near a Huge Resistance Level
Another beneficiary of this USD weakness has been a continued surge in Gold prices. As the Fed backed down from the median expectation of four rate hikes for this year, Gold prices surged up to new highs after breaking out of a 2-year-plus down-ward sloping channel. The big level in Gold is at $1,283.82, which is the 38.2% retracement of the ‘big picture’ move in Gold, taking the low from the year 1999 to the highs set in 2011. This price had also set the high in Gold prices before the near-term range began to build. So, this is somewhat of the apex of near-term resistance.
This level can be useful in a couple of ways. Given that we’re in a zone of resistance, traders would likely want to be cautious of buying here, instead, electing to buy if price action can drop down into the support zone of $1,200.41-$1,217.26; but given the potential efficacy of this Fibonacci retracement, traders may be able to use this level to peg breakout approaches, or even trend-resumption entries.
As in, if prices can break above $1,283.82 early next week, there are two more resistance levels just a bit higher at $1,301.61 and again at $1,307.49. Traders can look for the ‘higher-high’ to come in around this vicinity, and then can look to buy if prices can find support on this prior (which is current at the moment) batch of resistance at $1,283.82. The longer-term or the more traders that may be watching a level, the more usable it can become; and given the aggressive reaction we saw in the middle of March, it would appear as though this is a widely-followed level at the moment.

Created with Marketscope/Trading Station II; prepared by James Stanley
--- Written by James Stanley, Analyst for DailyFX.com
To receive James Stanley’s analysis directly via email, please SIGN UP HERE
Contact and follow James on Twitter: @JStanleyFX


