Crude Oil Prices Talking Points:
- Crude oil prices have turned higher as OPEC has announced that it will extend its production cut through March 2020, confirming earlier reports that oversupply concerns persist.
- Geopolitical tensions with Iran remain elevated, and the constant threat of a disruption to the global supply chain may be putting a floor under energy markets.
- Retail trader positioning suggests that crude oil prices may run higher, and contemporaneously, USDCAD could soon trade lower.
Looking for longer-term forecasts on oil prices? Check out the DailyFX Trading Guides.
The start of a new month and a new quarter has investors breathing a collective sigh of relief on Monday, after the G20 summit in Osaka, Japan yielded a détente in the US-China trade war. With US President Donald Trump and Chinese President Xi Jingping’s meeting on the sidelines of the G20 summit thawing the chill between the world’s two largest economies, risk appetite has rebounded on Monday amid strength in global equity markets. The prospect of relaxation of tensions is proving good for global growth prospects, spilling into oil.
OPEC Supply Production Cuts Extended to March 2020
It’s not just a change in tune surrounding the US-China trade war that’s helping energy markets at the start of July and Q3’19. Amid concerns of a slowing global economy and oversupply thanks to a sharp jump in US production in recent years, OPEC announced on Monday that it will extend its supply cuts until March 2020. The supply cuts were set to expire at the end of June. OPEC+, a group that includes Russia, has been working towards reducing production of oil for the past two years, ever since the US overtook Saudi Arabia as the global leader in oil production.
OPEC Losing its Credibility – A Grey Swan
But agreement among OPEC+ members to keep the supply cuts in place doesn’t mean that everyone was holding hands and singing kumbaya. Citing “unilateralism” between Russia and Saudi Arabia, Iranian Oil Minister Bijan Zanganeh said that while “Iran is not going to leave OPEC… But I believe OPEC is going to die if these processes continue… The important thing to me is that OPEC remains OPEC. It has lost its authority and it is on the verge of collapse.”
As we said in our annual Grey Swans – Events to Watch for in 2019 report, “As US energy independence rolls forward, it’s reasonable to expect greater coordination between Russia and Saudi Arabia, the other two major global energy producers. But in the event that the lesser OPEC members become stifled by Russian influence over the body’s decision making, OPEC could dissolve itself, sending energy markets into disarray.” It would now appear that the prospect of OPEC dissolving (scenario #5 in the 2019 Grey Swans report) is now in play.
Geopolitical Tensions with Iran to Remain High
Two other developments regarding Iran are front and center today that suggest geopolitical tensions with Iran will remain higher, thereby helping keeping a floor under energy markets and crude oil prices. First, Iran has cleared the limit on the uranium supply permitted under the 2015 nuclear agreement, according to the International Atomic Energy Agency. While the US isn’t party to the agreement anymore, this could be considered an act of provocation(from the US’ perspective). Second, the head of Israel’s Mossad intelligence service said of the recent attacks on Saudi oil tankers, “Iran is behind these attacks. They were approved by Iranian leadership and carried out, in large part, by the Islamic Revolutionary Guard Corps and its proxies.”
Let’s keep these comments in context of why Iran matters for the global supply chain for oil. The Strait of Hormuz, controlled by Iran, sees somewhere between 30-40% of the global oil supply pass through it every day. Accordingly, the repeated threats by Iran to cutoff access to this crucial global shipping lane may be helping undergird the rebound in price action.
Crude Oil Technical Analysis: Daily Price Chart (July 2018 to July 2019) (Chart 1)

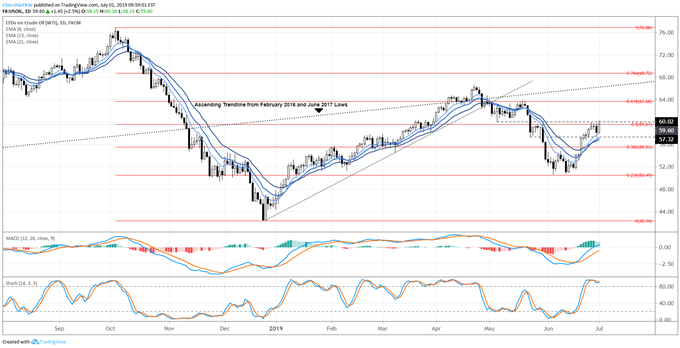
Crude oil prices continue to rebound following the bullish key reversal on June 18. Now that the May 23 swing low at 57.32 has been cleared out to the topside, 59.61 (May 6 swing low), 60.02 (50% retracement of Q4’18 high/low range), and 63.68 (61.8% retracement of Q4’18 high/low range) are in focus to the topside. Momentum remains bullish in the near-term, with crude oil prices above the daily 8-, 13-, and 21-EMA envelope, while both daily MACD and Slow Stochastics are in bullish territory. The near-term bullish outlook is invalidated below the daily 8-EMA.
IG Client Sentiment Index: Crude Oil Price Forecast (July 1, 2019) (Chart 2)

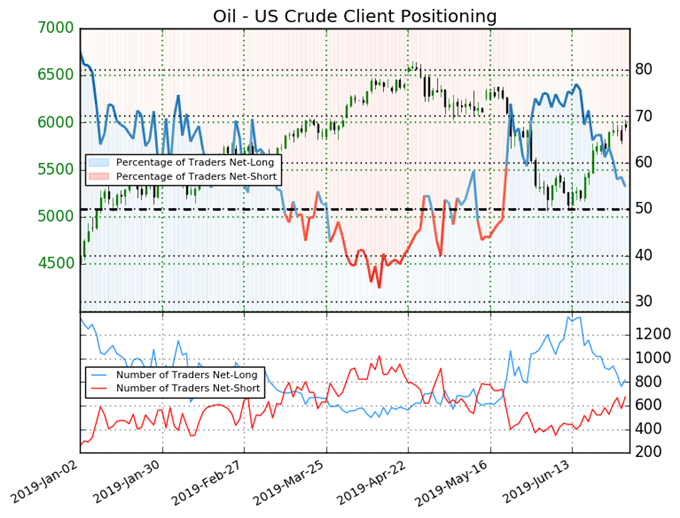
Crude oil prices: Retail trader data shows 69.5% of traders are net-long with the ratio of traders long to short at 2.28 to 1. In fact, traders have remained net-long since May 22 when crude oil prices traded near 63.76; price has moved 10.7% lower since then. The number of traders net-long is 3.5% lower than yesterday and 13.8% lower from last week, while the number of traders net-short is 1.0% lower than yesterday and 4.4% lower from last week.
We typically take a contrarian view to crowd sentiment, and the fact traders are net-long suggests crude oil prices may continue to fall. Yet traders are less net-long than yesterday and compared with last week. Recent changes in sentiment warn that the current crude oil price trend may soon reverse higher despite the fact traders remain net-long.
USDCAD Technical Analysis: Daily Price Chart (December 2017 to July 2019) (Chart 3)

In our last update on June 20 it was noted that “As a result, USDCAD may now be targeting the area around 1.3120, where the 61.8% retracement of the Q4’18 high/low range and the 38.2% retracement of the 2018 high/low range converge.” The target was reached. Despite the USDCAD rebound on Monday in line with the broader US Dollar rally, the path of least resistance for USDCAD remains to the downside.
Mainly, USDCAD remains below the rising trendline from the February 2018, September 2018, and March 2019 swing lows. Similarly, USDCAD continues to trade below the daily 8-, 13-, and 21-EMA envelope, which remains in bearish sequential order. Both daily MACD and Slow Stochastics are trending lower in bearish territory. The bearish outlook remains valid until USDCAD clears the daily 8-EMA.
IG Client Sentiment Index: USDCAD Price Forecast (July 1, 2019) (Chart 4)

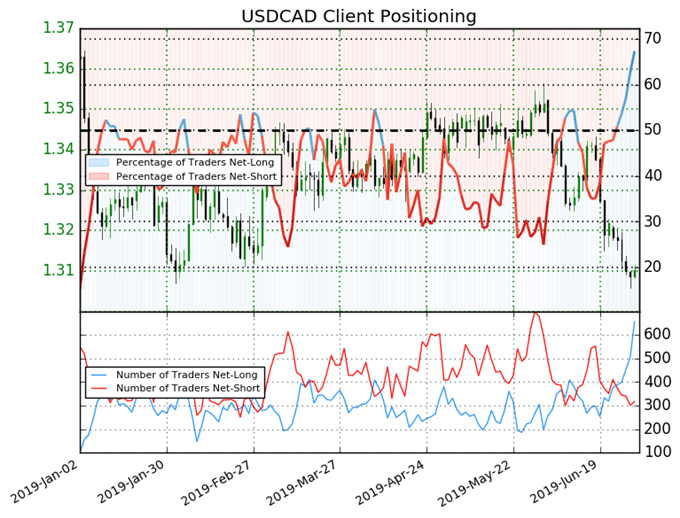
USDCAD: Retail trader data shows 67.4% of traders are net-long with the ratio of traders long to short at 2.06 to 1. The number of traders net-long is 36.7% higher than yesterday and 70.8% higher from last week, while the number of traders net-short is 2.8% lower than yesterday and 26.2% lower from last week.
We typically take a contrarian view to crowd sentiment, and the fact traders are net-long suggests USDCAD prices may continue to fall. Traders are further net-long than yesterday and last week, and the combination of current sentiment and recent changes gives us a stronger USDCAD-bearish contrarian trading bias.
FX TRADING RESOURCES
Whether you are a new or experienced trader, DailyFX has multiple resources available to help you: an indicator for monitoring trader sentiment; quarterly trading forecasts; analytical and educational webinars held daily; trading guides to help you improve trading performance, and even one for those who are new to FX trading.
--- Written by Christopher Vecchio, CFA, Senior Currency Strategist
To contact Christopher Vecchio, e-mail at cvecchio@dailyfx.com
Follow him on Twitter at @CVecchioFX
View our long-term forecasts with the DailyFX Trading Guides


