


Mexican Peso Technical Price Outlook: USD/MXN Near-term Trade Levels
- Mexican Peso updated technical trade levels – Daily & Intraday Charts
- USD/MXN breakdown sets weekly opening-range just below key pivot zone at 21.2316/2942
- Key near-term support 20.6789 – Bearish invalidation at monthly-open resistance
The US Dollar is down more than 0.4% against the Mexican Peso into the start of the week after breaking below a key pivot zone on Friday. A well-defined descending technical pattern leaves USD/MXN vulnerable to further losses near-term with the immediate focus on a break of the weekly opening-range for guidance. These are the updated targets and invalidation levels that matter on the USD/MXN technical price charts. Review my latest Strategy Webinar for an in-depth breakdown of this Peso setup and more.
Mexican Peso Price Chart – USD/MXN Daily
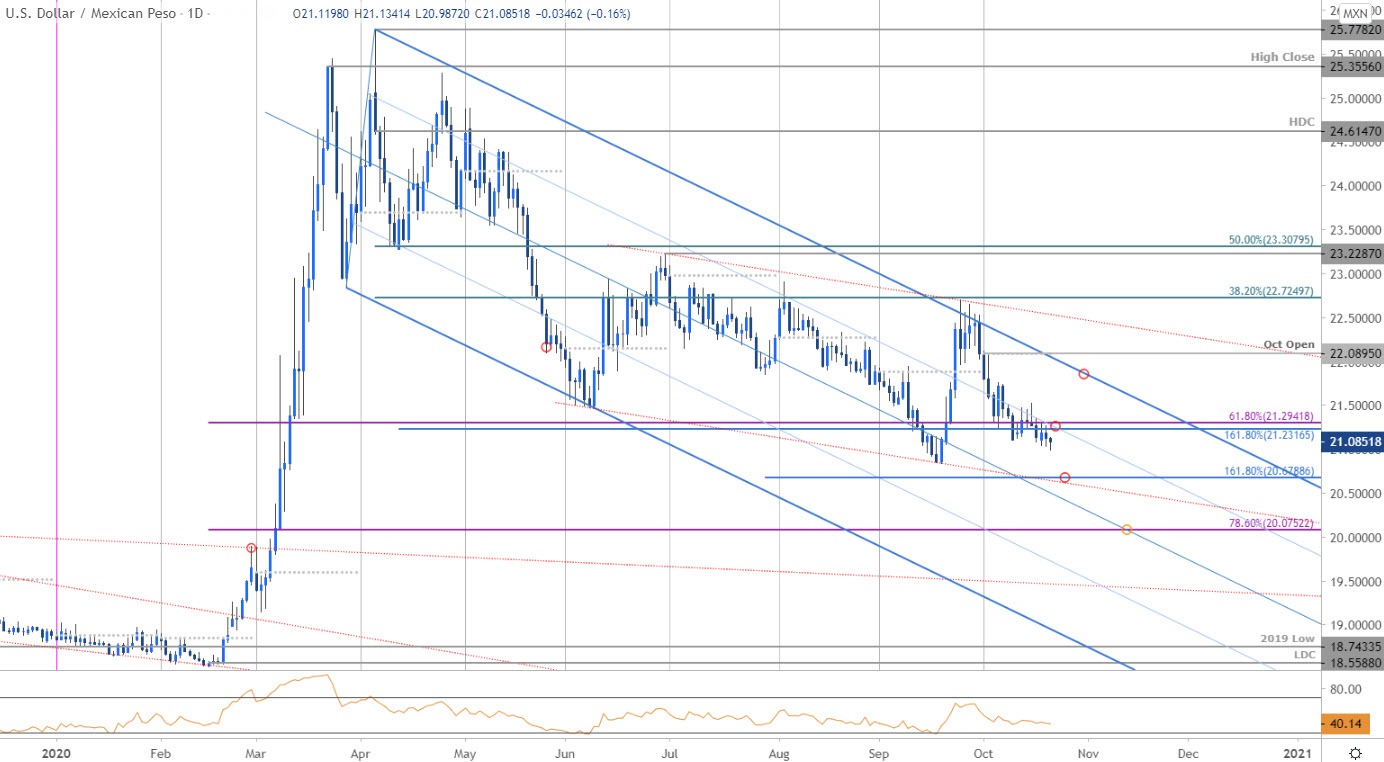
Chart Prepared by Michael Boutros, Technical Strategist; USD/MXN on Tradingview
Technical Outlook: In my last Mexican Peso Price Outlook we noted that the USD/MXN sell-off was, “testing a break of a key pivot zone we’ve been tracking at 21.2316/2942 – from a trading standpoint, the risk remains tilted to the downside while within this formation.” Price slipped below this threshold on Friday with the USD/MXN testing this zone as resistance over the past few days.
Daily support objectives remain unchanged at the 1.618% Fibonacci extension of the decline off the June highs at 20.6788 backed by the 78.6% retracement of the yearly range at 20.0752. A pivot / close back above 21.2942 would risk a larger rebound towards trendline resistance with bearish invalidation now lowered to the objective October open at 22.0895.
Mexican Peso Price Chart – USD/MXN 120min
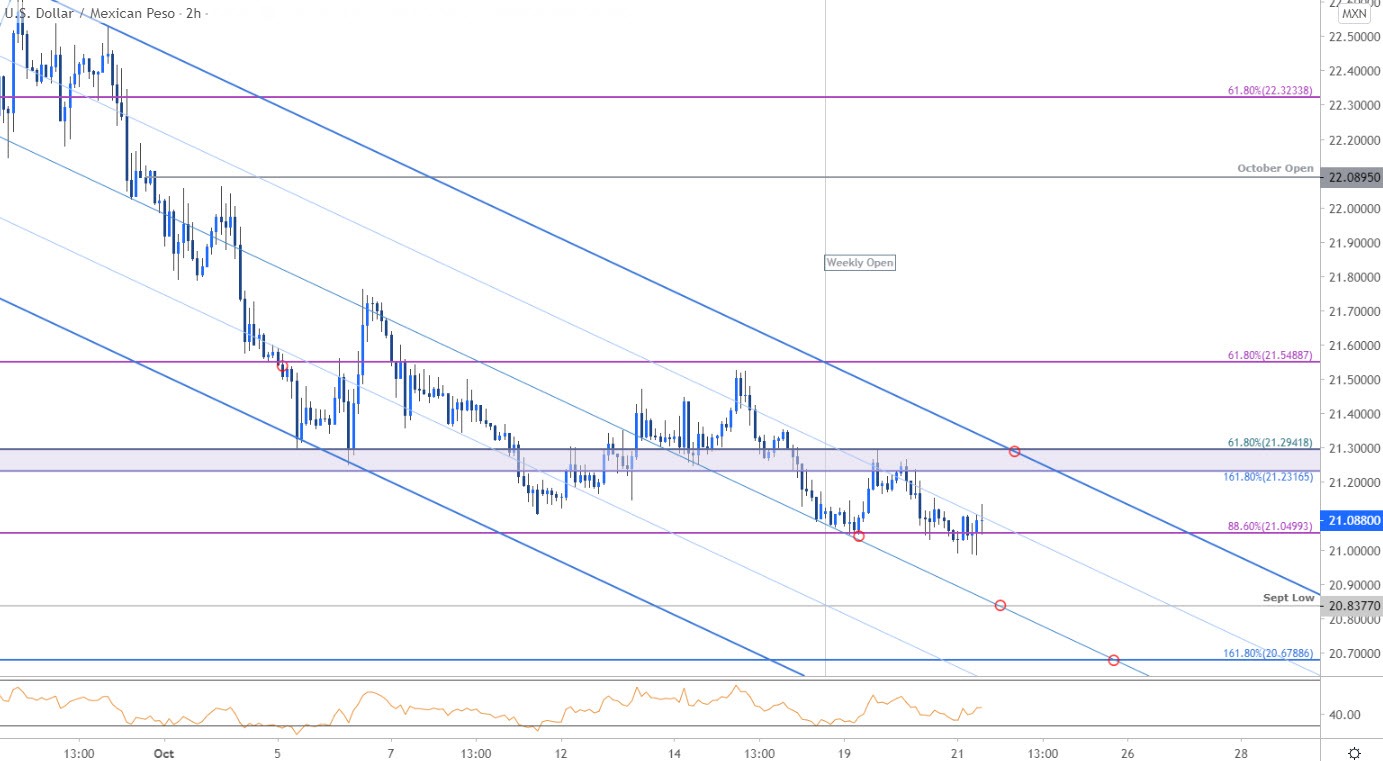
Notes: A closer look at Peso price action shows USD/MXN trading within the confines of an descending pitchfork formation extending off the late-September highs with the pair rebounding off median-line support on Monday. The weekly opening-range is set just below the 21.2316-2942 resistance zone and we’re looking for the break to offer guidance. A break lower keeps the focus on the September low at 20.8377 and 20.6788. A topside breach of the weekly range would risk a larger price recovery with such a scenario exposing the 61.8% retracement at 21.5489 and daily slope resistance near ~21.8500.

Bottom line: The USD/MXN has broken below a key pivot zone but the follow-though looks a bit tired here. Look for topside exhaustion while within this near-term formation with a break lower here keeping the focus objectives into the lower parallels. Ultimately a larger sell-off may offer more favorable opportunities with a breach above the monthly open still needed to shift the broader focus higher again.
For a complete breakdown of Michael’s trading strategy, review his Foundations of Technical Analysis series on Building a Trading Strategy
---
Key US / Mexico Data Releases
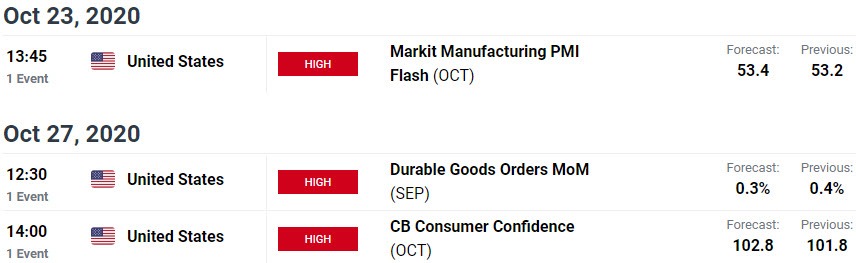
Economic Calendar - latest economic developments and upcoming event risk.
Active Technical Setups
- Gold Price Outlook: XAU/USD Coils into October Range- GLD Technicals
- Euro Dollar Technical Outlook: EUR/USD Defends Monthly Open Support
- Canadian Dollar Outlook: USD/CAD Breakdown Stalls
- Australian Dollar Forecast: AUD/USD Breakout Pending- Aussie Setup
--- Written by Michael Boutros, Technical Strategist with DailyFX
Follow Michael on Twitter @MBForex


