


- Updated weekly technicals on Gold (XAU/USD) – constructive while above 1302
- Check out our 2019 projections in our Free DailyFX Gold Trading Forecasts
- Join Michael for Live Weekly Strategy Webinars on Mondays at 12:30GMT
Gold prices have continued to march higher after breaking through resistance last week with the precious metal already up more than 1.1% since the Sunday open. Here are the key targets & invalidation levels that matter on the Gold (XAU/USD) weekly chart.
New to Gold Trading? Get started with this Free How to Trade Gold -Beginners Guide
Gold Weekly Price Chart (XAU/USD)
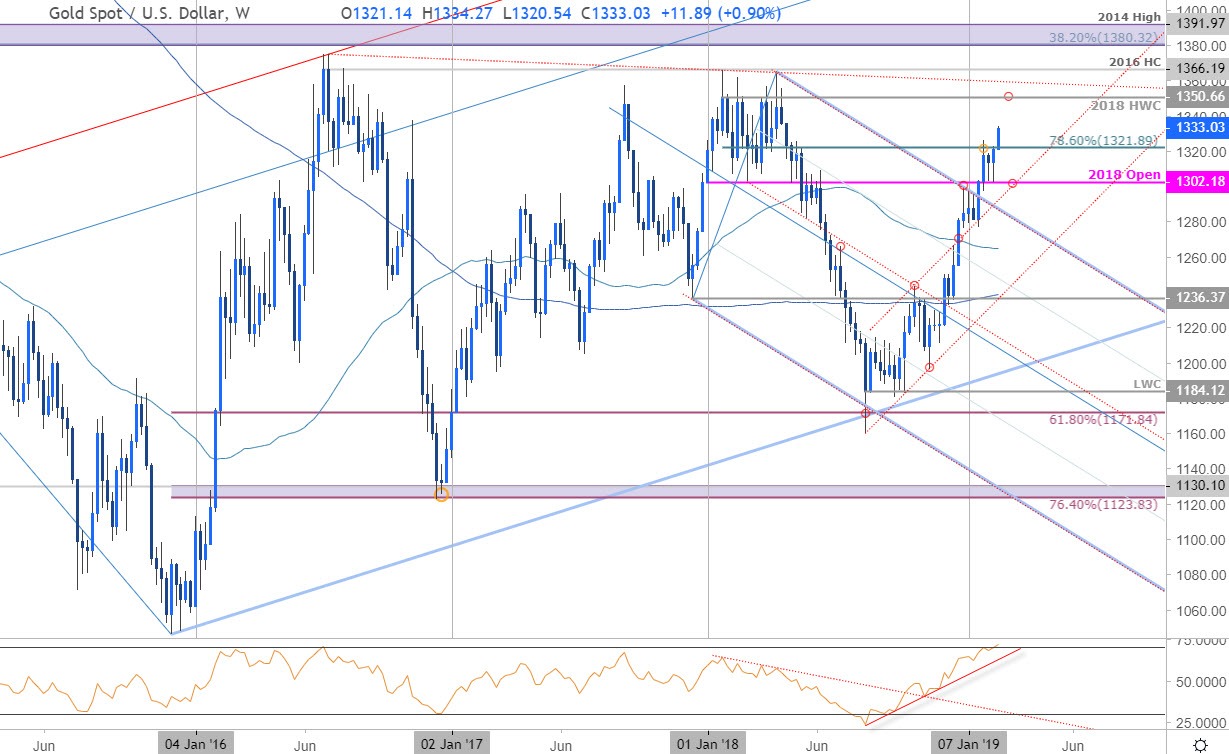
Notes: In my previous Gold Weekly Technical Outlook we noted that the, “immediate focus is on a break of the 1302-1322 zone early in the month with the broader outlook weighted to the topside while above 1290. From a trading standpoint, we’ll favor fading weakness while above confluence support targeting a breach higher in price.” Bullion registered a low at 1302 last week before reversing sharply higher with the advance breaking through Fibonacci resistance at 1322 early in the week. Note that weekly RSI has is now probing into overbought territory – watch the close this week for guidance with a hold above needed to keep the immediate the long-bias viable.
Look for initial support at the weekly open at 1321 with bullish invalidation now raised to 1302. Weekly resistance stands at the 2018 high-day & high-week closes at 1348/50backed closely by the 2016 trendline just higher around ~1360s.
For a complete breakdown of Michael’s trading strategy, review his Foundations of Technical Analysis series on Building a Trading Strategy
Bottom line:The focus is higher while above 1302 with price now approaching subsequent resistance objectives. From a trading standpoint, looking to reduce long-exposure just higher and be on the lookout for near-term exhaustion on a stretch towards 1350. Review my latest Gold Price Outlook for a closer look at the near-term trading levels.
Even the most seasoned traders need a reminder every now and then- Avoid these Mistakes in your trading
Gold Trader Sentiment
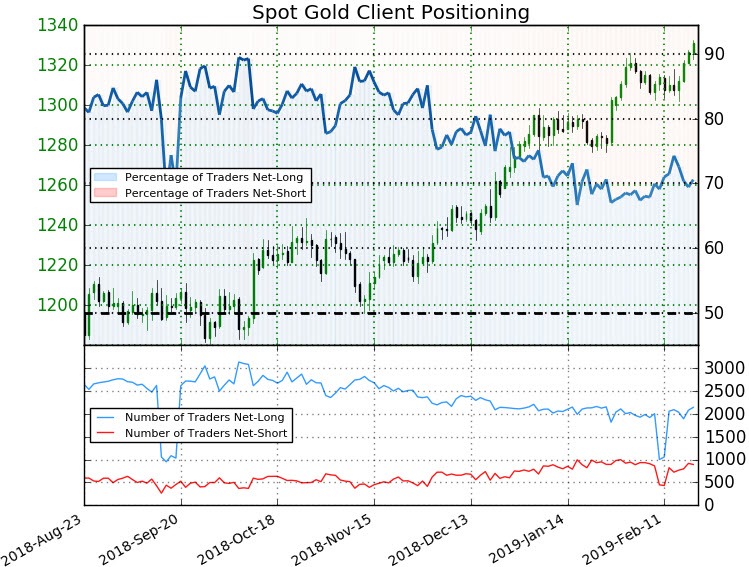
- A summary of IG Client Sentiment shows traders are net-long Gold - the ratio stands at +2.4 (70.6% of traders are long) – bearish reading
- Long positions are 9.2% higher than yesterday and 94.4% higher from last week
- Short positions are0.1% lower than yesterday and 97.3% higher from last week
- We typically take a contrarian view to crowd sentiment, and the fact traders are net-long suggests Spot Gold prices may continue to fall. Traders are more net-long than yesterday but less net-long from last week and the combination of current positioning and recent changes gives us a further mixed Spot Gold trading bias from a sentiment standpoint.
See how shifts in Gold retail positioning are impacting trend- Learn more about sentiment!
Previous Weekly Technical Charts
- British Pound (GBP/USD)
- Euro (EUR/USD)
- Japanese Yen (USD/JPY)
- Euro vs Japanese Yen (EUR/JPY)
- Canadian Dollar (USD/CAD)
- New Zealand Dollar (NZD/USD)
- Crude Oil (WTI)
Learn how to Trade with Confidence in our Free Trading Guide
--- Written by Michael Boutros, Technical Currency Strategist with DailyFX
Follow Michael on Twitter @MBForex


