


- Gold clears January opening-range highs – risk for pullback but constructive above 1280
- Check out our 2019 projections in our Free DailyFX Gold Trading Forecasts
- Join Michael for Live Weekly Strategy Webinars on Mondays at 12:30GMT
Gold prices are trading within a well-defined range just below the monthly open and we’re looking for the break for guidance. These are the updated targets and invalidation levels that matter on the XAU/USD charts. Review this week’s Strategy Webinar for an in-depth breakdown of this setup and more.
New to Gold Trading? Get started with this Free How to Trade Gold -Beginners Guide
Gold Daily Price Chart (XAU/USD)
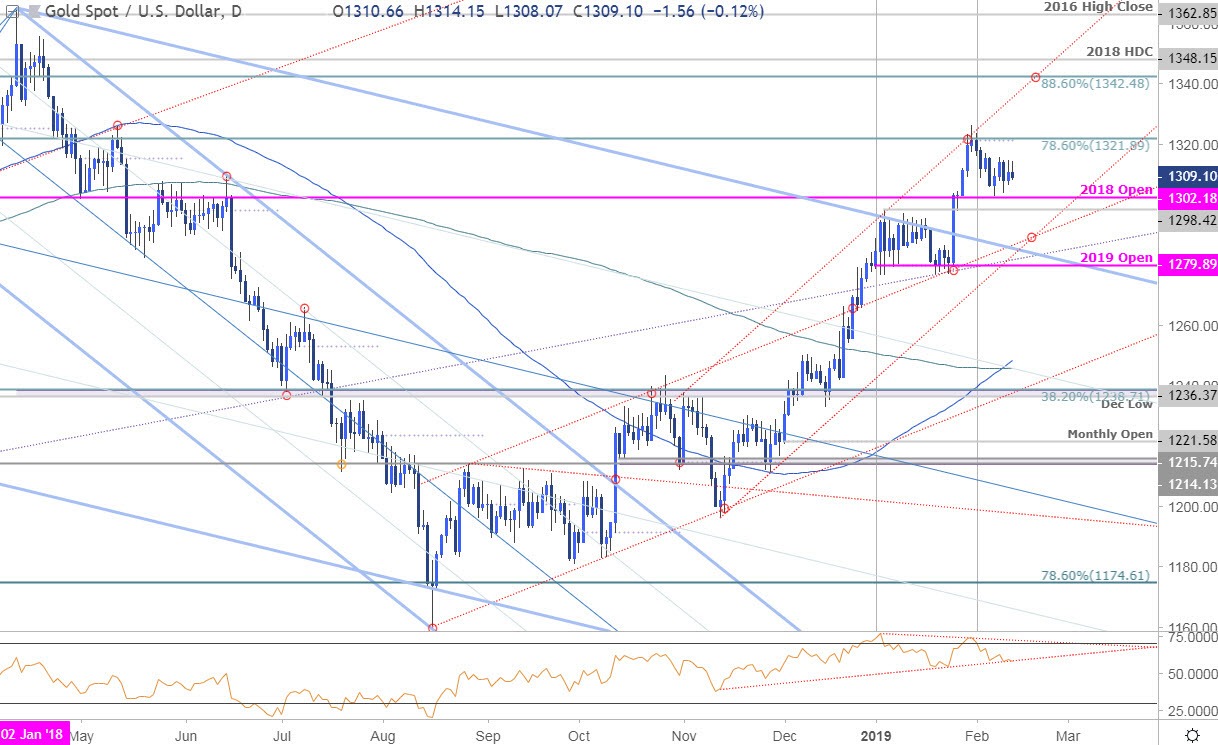
Technical Outlook: In my latest Gold Weekly Technical Outlook we noted that the, “immediate focus is on a break of the 1302-1322 zone early in the month with the broader outlook weighted to the topside while above 1290.” Price registered a low at 1303 early in the week with gold now setting the February opening-range between these key levels. A downside break would threaten a larger correction towards the highlighted slope confluence with our medium-term bullish invalidation steady around ~1290.
A topside breach / close above the 78.6% retracement / monthly open at 1322 is needed to mark resumption of the broader uptrend with subsequent topside objectives eyed at channel resistance / 88.6% retracement at 1342 and the 2018 high-day close at 1348.
Why does the average trader lose? Avoid these Mistakes in your trading
Gold 120min Price Chart (XAU/USD)
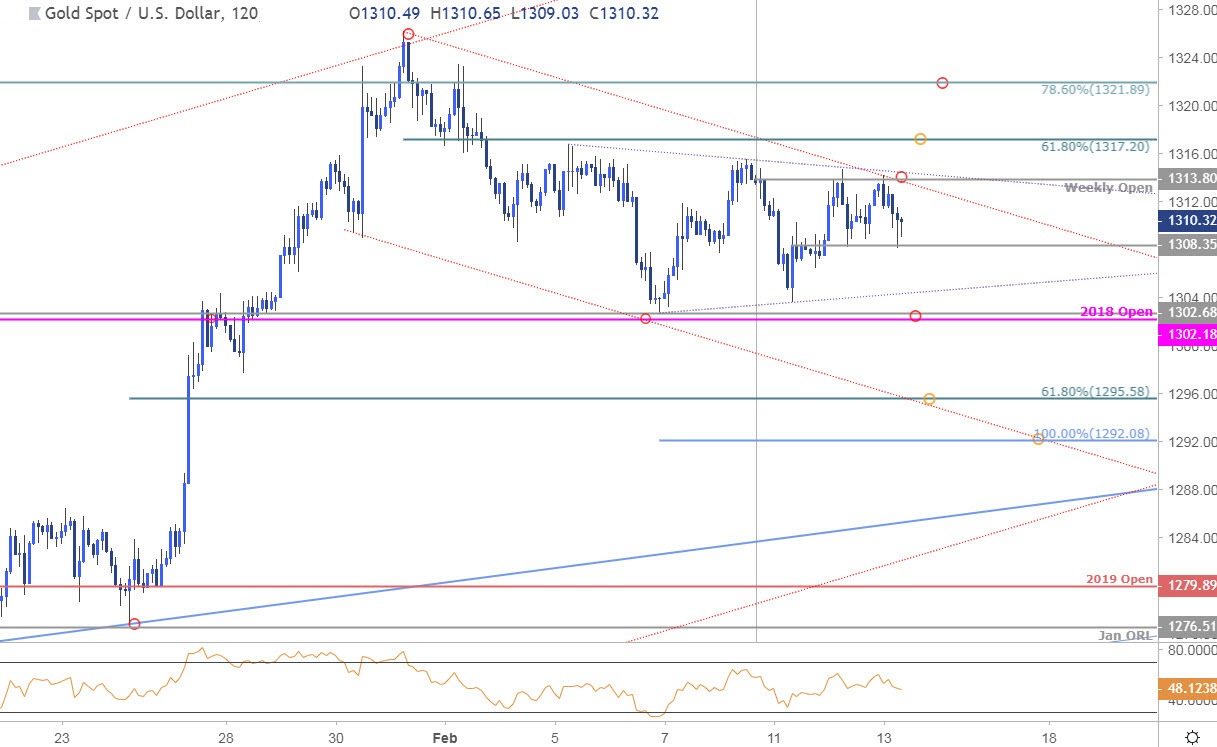
Notes: A closer look at price action shows gold trading within the confines of a descending channel formation extending off the January high with price marking a near-term consolidation range just below the upper parallel. Immediate resistance stands with the weekly open at 1313 with a topside breach exposing 1317 and 1322- look for a larger reaction there for guidance.
Initial support rests with the outside two-hour reversal close at 1308 backed by near-term bullish invalidation at 1302. Weakness beyond this threshold would expose support targets at the 61.8% retracement at 1296 and 1292- an area of interest for exhaustion If reached.
Learn how to Trade with Confidence in our Free Trading Guide
Bottom line: We’re looking for a break of this near-term consolidation for guidance and while our broader outlook remains weighted to the topside, a break lower could risk a larger pullback before resumption. From a trading standpoint, we’ll favor fading strength while above while above 1302 targeting a topside breach of the monthly opening-range. Ultimately larger set-back would have us looking for exhaustion closer to slope support around 1290.
For a complete breakdown of Michael’s trading strategy, review his Foundations of Technical Analysis series on Building a Trading Strategy
Gold Trader Sentiment
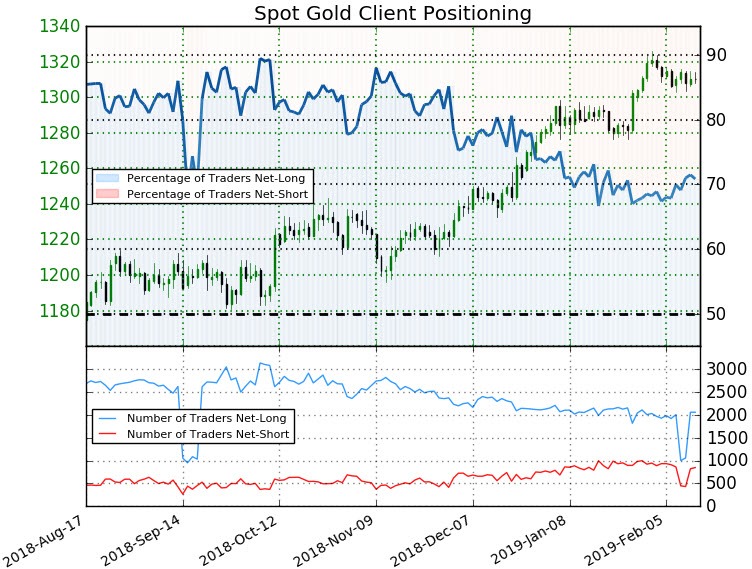
- A summary of IG Client Sentiment shows traders are net-long Gold - the ratio stands at +2.43 (70.8% of traders are long) – bearishreading
- Long positions are84.8% higher than yesterday and 1.3% higher from last week
- Short positions are 79.2% higher than yesterday and 9.8% lower from last week
- We typically take a contrarian view to crowd sentiment, and the fact traders are net-long suggests Gold prices may continue to fall. Traders are further net-long than yesterday & last week, and the combination of current positioning& recent changes gives us a stronger Gold-bearish contrarian trading bias from a sentiment standpoint.
See how shifts in Gold retail positioning are impacting trend- Learn more about sentiment!
---
Active Trade Setups
- EUR/USD Price Outlook: Euro Back Above 1.13 – Bull Trap or Breakout?
- Gold Price Technical Outlook: XAU/USD to Threaten Deeper Correction
- Canadian Dollar Price Outlook: USD/CAD Testing Key Trend Support
- Written by Michael Boutros, Currency Strategist with DailyFX
Follow Michael on Twitter @MBForex


