


- Updated weekly technicals on AUD/USD – reversal off key resistance targeting Fibonacci support
- Check out our 4Q projections in our Free DailyFX USD Trading Forecasts
- Join Michael for Live Weekly Strategy Webinars on Mondays at 12:30GMT
In this series we scale-back and look at the broader technical picture to gain a bit more perspective on where we are in trend. The Australian Dollar has come under considerable pressure after reversing off confluence resistance into the start of December trade. Here are the key targets & invalidation levels that matter on the AUD/USD weekly chart heading into the close of the year.
New to Forex Trading? Get started with this Free Beginners Guide
AUD/USD Weekly Price Chart

Notes: In my previous AUD/USD Weekly Technical Outlook we noted that Aussie was trading within the confines of this descending pitchfork formation extending off the 2017 & 2018 highs with a key resistance confluence eyed at the upper parallel. Our ‘bottom line’ cited a constructive outlook but that, ‘Ultimately a breach above the May low-week close at 7385 would be needed to suggest a more significant low is in place.’
Aussie registered a high at 7393 into the open of the month before reversing sharply lower. Price is poised to post an outside weekly reversal off confluence resistance if we close at these levels (typically bearish) and leaves the October advance at risk while below this threshold. Interim support targets rests at 61.8% retracement at 7163 with a break below the yearly low-week close at 7087 needed to mark resumption of the broader downtrend targeting the 2016 low-week close at 6970. A topside breach of this formation would shift the focus back toward the 52-week / 200-week moving averages at ~7500/10.
For a complete breakdown of Michael’s trading strategy, review his Foundations of Technical Analysis series on Building a Trading Strategy
Bottom line: Aussie is carving its monthly opening range just below technical resistance an leaves price vulnerable to further losses while below 7385. From a trading standpoint, look for a reaction on a move into Fibonacci support at 7163- weakness beyond this point would keep the focus on 7087. For now, our focus will be on the weekly close. I’ll publish an updated AUD/USD scalp report once we get further clarity on near-term price action.
Even the most seasoned traders need a reminder every now and then- Avoid these Mistakes in your trading
AUD/USD Trader Sentiment
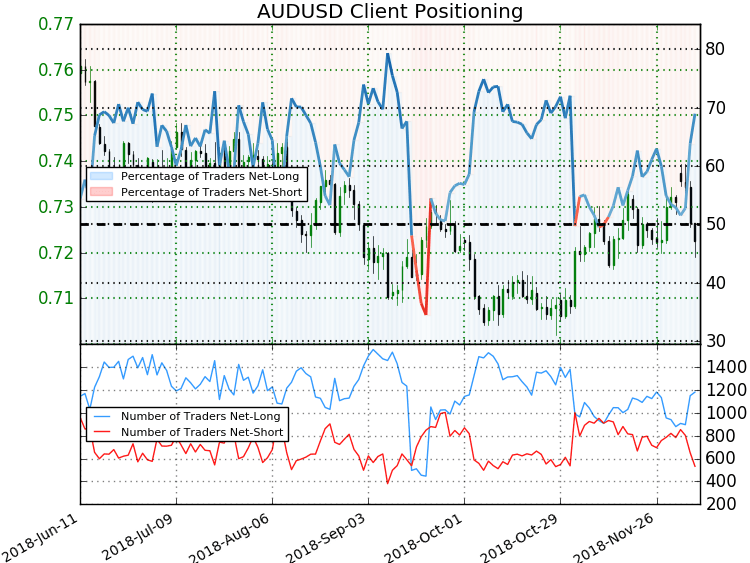
- A summary of IG Client Sentiment shows traders are net-long AUD/USD - the ratio stands at +2.22 (68.9% of traders are long) – bearish reading.
- Long positions are 12.4% higher than yesterday and 22.3% higher from last week
- Short positions are 23.5% lower than yesterday and 42.5% lower from last week
- We typically take a contrarian view to crowd sentiment, and the fact traders are net-long suggests AUD/USD prices may continue to fall. Traders are further net-long than yesterday & last week, and the combination of current positioning and recent changes gives us a stronger AUD/USD-bearish contrarian trading bias from a sentiment standpoint.
See how shifts in AUD/USD retail positioning are impacting trend- Learn more about sentiment!
Relevant AUD/USD Data Releases

Economic Calendar – for the latest economic developments and upcoming event risk. Learn more about how we Trade the News in our Free Guide!
Previous Weekly Technical Charts
- Canadian Dollar (USD/CAD)
- Gold (XAU/USD)
- Crude Oil (WTI)
- Euro vs Japanese Yen (EUR/JPY)
- Euro (EUR/USD)
- Australian Dollar vs Japanese Yen (AUD/JPY)
- New Zealand Dollar (NZD/USD)
Learn how to Trade with Confidence in our Free Trading Guide
--- Written by Michael Boutros, Technical Currency Strategist with DailyFX
Follow Michael on Twitter @MBForex or contact him at mboutros@dailyfx.com
https://www.dailyfx.com/forex/video/live_events/2018/11/26/Weekly-Trade-Levels-for-EURUSD-AUDUSD-NZDUSD-Gold-Technical-Price-Chart-Outlook-Forecast-MBCS.html?ref-author=Boutros


