


- Updated weekly technicals on Gold – rally testing critical resistance barrier at 1236/38
- Check out our 4Q projections in our Free DailyFX Gold Trading Forecasts
- Join Michael for Live Weekly Strategy Webinars on Mondays at 12:30GMT
In this series we scale-back and look at the broader technical picture to gain a bit more perspective on where we are in trend. Gold prices have rallied nearly 7% from the yearly lows with price now testing a key resistance barrier at the October highs. Here are the key targets & invalidation levels that matter on the XAU/USD weekly chart heading into the close of the year.
New to Gold Trading? Get started with this Free How to Trade Gold -Beginners Guide
Gold Weekly Price Chart (XAU/USD)

Notes: In my previous Gold Weekly Technical Outlook we highlighted a constructive bias as price rebounded from confluence support. The advance is now testing a critical resistance zone at 1236/38- a region defined by the 38.2% retracement of the yearly range & the December 2017 low and converges on the 75% line of the descending pitchfork we’ve been tracking off the highs. Note that weekly RSI has broken and tested a resistance-trigger as support and further highlights a change of behavior in the broader momentum profile.
A weekly close above this threshold is needed to keep the long-bias viable with such a scenario targeting the 50% retracement at 1262 and the upper parallel / 200-week moving average at ~1270. The focus is higher while above channel support (red) around ~1205 with broader bullish invalidation steady at the yearly low-week close at 1184.
For a complete breakdown of Michael’s trading strategy, review his Foundations of Technical Analysis series on Building a Trading Strategy
Bottom line:Gold is testing a major resistance barrier here- watch the weekly close. From a trading standpoint, a good place to reduce long-exposure / raise protective stops. For now, I’ll favor fading weakness while within this channel targeting a topside breach of this barrier. I’ll publish an updated Gold scalp report once we get further clarity on near-term price action.
Even the most seasoned traders need a reminder every now and then- Avoid these Mistakes in your trading
Gold Trader Sentiment
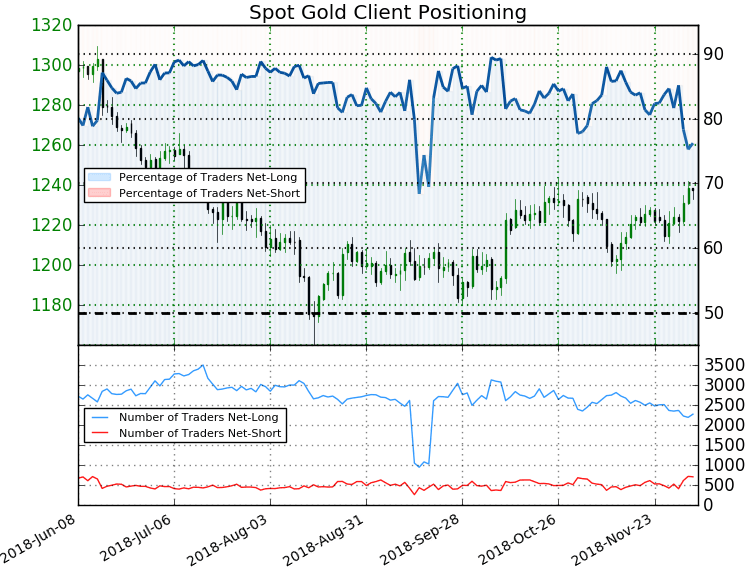
- A summary of IG Client Sentiment shows traders are net-long Gold - the ratio stands at +3.21 (76.2% of traders are long) – bearish reading
- Long positions are 2.1% higher than yesterday and 9.9% lower from last week
- Short positions are 3.6% higher than yesterday and 32.2% higher from last week
- We typically take a contrarian view to crowd sentiment, and the fact traders are net-long suggests Gold prices may continue to fall. Yet traders are less net-long than yesterday and compared with last week. Recent changes in sentiment warn that the current spot Gold price trend may soon reverse higher despite the fact traders remain net-long.
See how shifts in Gold retail positioning are impacting trend- Learn more about sentiment!
Previous Weekly Technical Charts
- Crude Oil (WTI)
- Euro vs Japanese Yen (EUR/JPY)
- Euro (EUR/USD)
- Australian Dollar vs Japanese Yen (AUD/JPY)
- New Zealand Dollar (NZD/USD)
- Australian Dollar (AUD/USD)
Learn how to Trade with Confidence in our Free Trading Guide
--- Written by Michael Boutros, Technical Currency Strategist with DailyFX
Follow Michael on Twitter @MBForex or contact him at mboutros@dailyfx.com


