


- Gold price reversal testing October trendline resistance - constructive above 1210
- Check out our 3Q projections in our Free DailyFX Gold Trading Forecasts
- Join Michael for Live Weekly Strategy Webinars on Mondays at 12:30GMT
Gold prices have continued to consolidate just below multi-month slope resistance and the battles lines are drawn heading into the December trade. These are the updated targets and invalidation levels that matter on the XAU/USD charts. Review this week’s Strategy Webinar for an in-depth breakdown of this setup and more.
New to Gold Trading? Get started with this Free How to Trade Gold -Beginners Guide
Gold Daily Price Chart (XAU/USD)
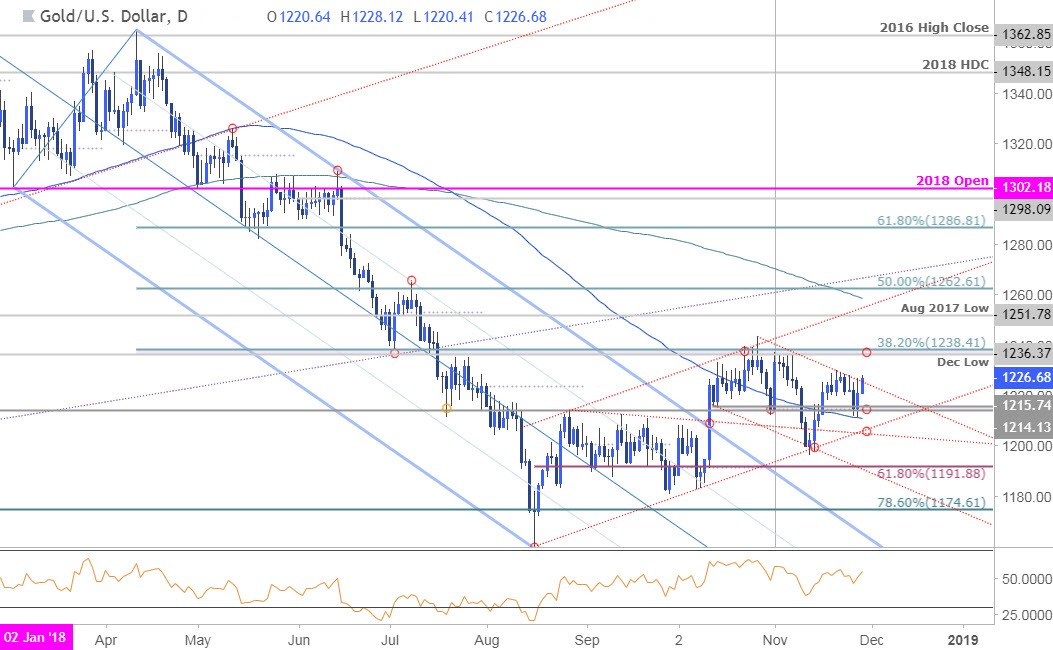
Technical Outlook: In our last Gold Technical Outlook our ‘bottom line’ stated that we were, “The recovery off the monthly low is now testing the first major resistance level- failure here would risk a drop back towards the lower parallels but the trade remains constructive while within this formation.” Gold registered a low this week at 1211 before reversing sharply off the 100-day moving average with the advance now back at the October trendline. A daily close above this slope is needed to mark resumption targeting critical resistance at the 1236/38 pivot zone. Key support and bullish invalidation rests with the highlighted trendline confluence around 1205.
Why does the average trader lose? Avoid these Mistakes in your trading
Gold 240min Price Chart (XAU/USD)
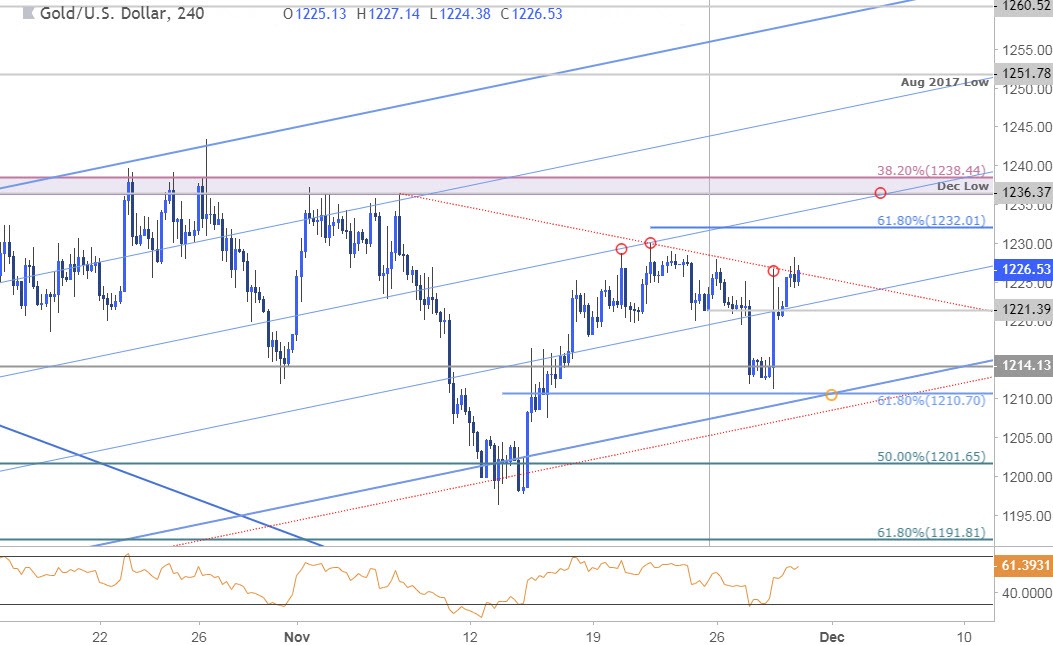
Notes: A closer look at price action highlights a well-defined weekly opening-range with gold testing the range highs early in New York trade. A breach here targets initial resistance objectives at the 61.8% extension of the November advance at 1232 backed by 1236/38- a breach above this threshold is needed to fuel the next leg higher with such a scenario targeting 1251 backed by the upper parallel / 1260.
Learn how to Trade with Confidence in our Free Trading Guide
Bottom line: The monthly opening-range remains intact heading into the November close. For now, look for a break of this week’s range for guidance with our broader focus higher while within this ascending pitchfork formation. From a trading standpoint, I continue to favor fading weakness while above 1210 targeting the median-line.
For a complete breakdown of Michael’s trading strategy, review his Foundations of Technical Analysis series on Building a Trading Strategy
Gold Trader Sentiment
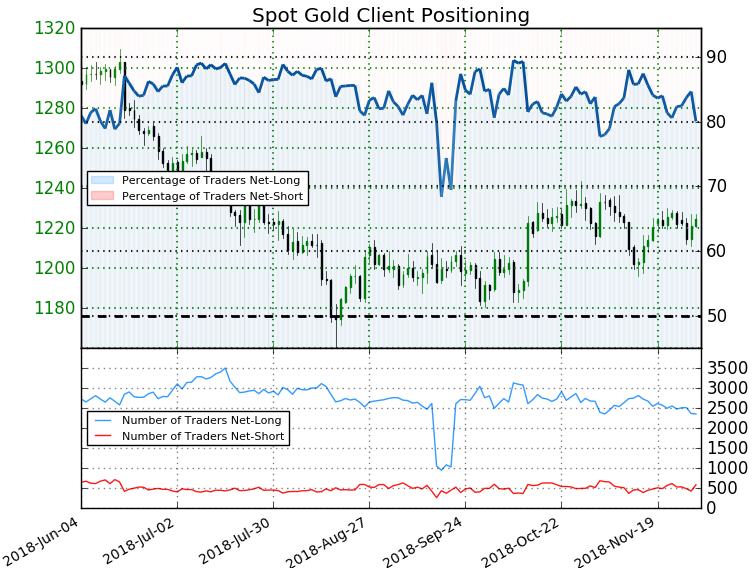
- A summary of IG Client Sentiment shows traders are net-long Gold - the ratio stands at +4.01 (80.1% of traders are long) – bearishreading
- The percentage of traders net-long is now its lowest since November 6th
- Long positions are6.1% lower than yesterday and 7.8% lower from last week
- Short positions are 9.5% higher than yesterday and 1.0% lower from last week
- We typically take a contrarian view to crowd sentiment, and the fact traders are net-long suggests spot Gold prices may continue to fall. Yet traders are less net-long than yesterday and compared with last week. Recent changes in sentiment warn that the current Gold price trend may soon reverse higher despite the fact traders remain net-long.
See how shifts in Gold retail positioning are impacting trend- Learn more about sentiment!
---
Active Trade Setups
- USD/CAD Price Outlook: Dollar on Steady March Higher to Resistance
- NZD/USD Price Outlook: Pending Bull Flag Breakout in Kiwi
- AUD/USD Outlook: Aussie Searches for Support after Failed Breakout
- EUR/USD Price Outlook: Euro Threatens Breakout– Levels to Know
- Written by Michael Boutros, Currency Strategist with DailyFX
Follow Michael on Twitter @MBForex or contact him at mboutros@dailyfx.com


