


- Updated weekly technicals on Crude Oil (WTI) – Risk for further losse sub-55.21
- Check out our 4Q projections in our Free DailyFX Crude Oil Trading Forecasts
- Join Michael for Live Weekly Strategy Webinars on Mondays at 12:30GMT
In this series we scale-back and look at the broader technical picture to gain a bit more perspective on where we are in trend. Crude oil has plummeted a staggering 33% from the yearly highs registered just last month with prices poised to snap a seven-week losing streak after rebounding from nearby confluence support. Here are the key targets & invalidation levels that matter on the Crude Oil (WTI)weekly chart heading into the close of the month. Review this week’s Strategy Webinar for an in-depth breakdown of this setup and more.
New to Oil Trading? Get started with this Free How to Trade Crude Oil Beginners Guide
Crude Oil Weekly Price Chart (WTI)
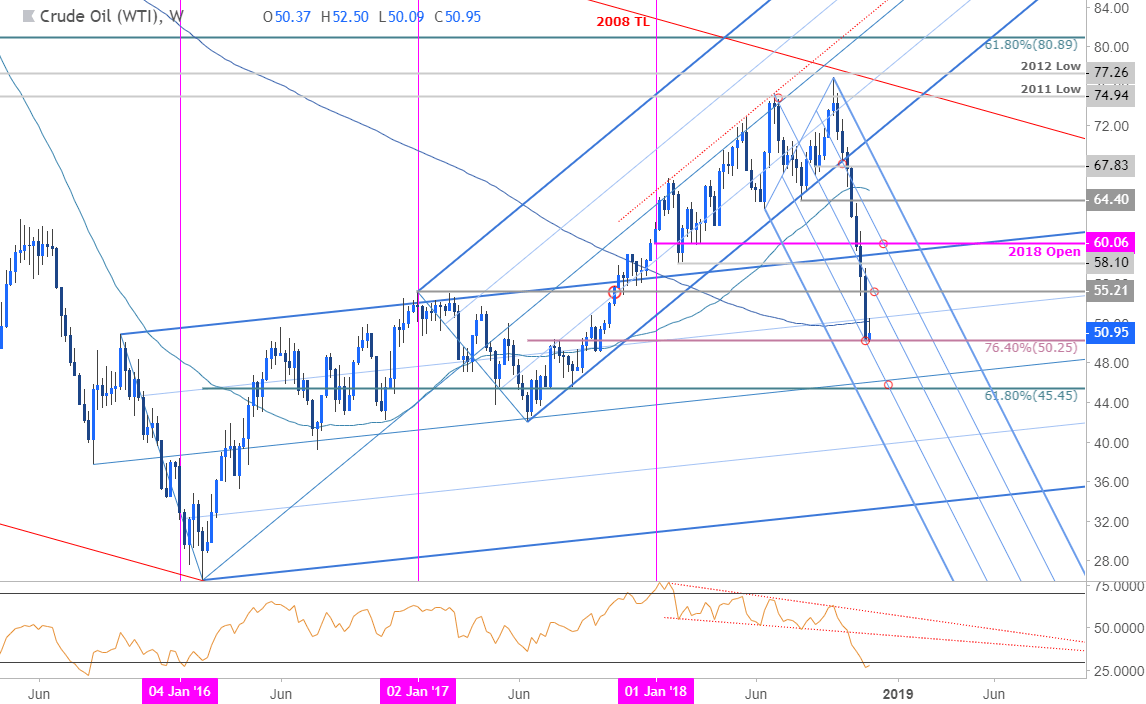
Notes: Earlier this month our ‘bottom line’ highlighted that crude oil prices were, “approaching the first major support confluence at 57.45-58.10.” We noted that a break below this zone would risk, “accelerated losses in crude prices with such a scenario targeting the 55-handle backed by the 200-week moving average around ~52.25”
Crude broke lower days later with price closing below the 200-week moving average last week. Initial support rests at 50.25 where the 50-line of the descending pitchfork extending off the early highs converges on the 76.4% retracement of the 2017 advance. It’s worth noting that typically I’m not a fan of these steep slopes but given the recent price action, we’ll take what we can get.
Initial resistance now stands back at the 200-week moving average (currently ~52.20) with a breach above 55.21 needed to alleviate further downside pressure. Broader bearish invalidation rests with the yearly open at 60.06. A downside break from here keeps the focus on more significant support zone at the median-line of the 2015/2016 slope / 61.8% retracement at 45.45-46.24.
For a complete breakdown of Michael’s trading strategy, review his Foundations of Technical Analysis series on Building a Trading Strategy
Bottom line: Crude prices could see some back & fill here but the risk remains lower sub-55.21. Note that momentum is still in oversold territory and from a trading standpoint there is nothing to do on the long-side just yet. Ideal scenario sees a washout towards 46 before mounting a more meaningful recovery. I’ll publish an updated scalp report once we get further clarity on near-term price action.
Even the most seasoned traders need a reminder every now and then- Avoid these Mistakes in your trading
Crude Oil Trader Sentiment
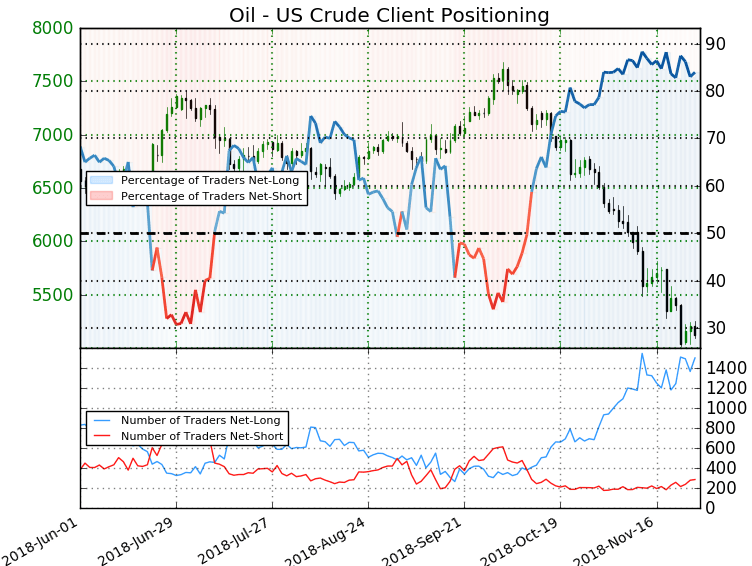
- A summary of IG Client Sentiment shows traders are net-long Crude Oil - the ratio stands at +5.39 (84.4% of traders are long) – bearish reading
- Traders have remained net-long since October 11th; price has moved 31.0% lower since then
- Long positions are10.2% lower than yesterday and 12.9% higher from last week
- Short positions are 5.6% higher than yesterday and 26.0% higher from last week
- We typically take a contrarian view to crowd sentiment, and the fact traders are net-long suggests Crude prices may continue to fall. Yet traders are less net-long than yesterday & compared with last week andthe recent changes in sentiment warn that the current Oil - US Crude price trend may soon reverse higher despite the fact traders remain net-long.
See how shifts in Crude Oil retail positioning are impacting trend- Learn more about sentiment!
Previous Weekly Technical Charts
- Euro vs Japanese Yen (EUR/JPY)
- Euro (EUR/USD)
- Gold (XAU/USD)
- Australian Dollar vs Japanese Yen (AUD/JPY)
- New Zealand Dollar (NZD/USD)
- Australian Dollar (AUD/USD)
- US Dollar Index (DXY)
Learn how to Trade with Confidence in our Free Trading Guide
--- Written by Michael Boutros, Technical Currency Strategist with DailyFX
Follow Michael on Twitter @MBForex or contact him at mboutros@dailyfx.com


