


- USD/JPY rally approaching key weekly resistance- Longs at risk sub-111.62
- Check out our 3Q projections in our Free USD/JPY DailyFXTrading Forecasts
- Join Michael for Live Weekly Strategy Webinars on Mondays at 12:30GMT
The Japanese Yen has fallen (USD/JPY up) nearly 3% from the May extremes with the price now approaching an area of technical significance. These are the updated intraday targets & invalidations levels that matter on the USD/JPY price charts. Review this week’s Strategy Webinar for an in-depth breakdown of this setup and more.
USD/JPY Daily Price Chart
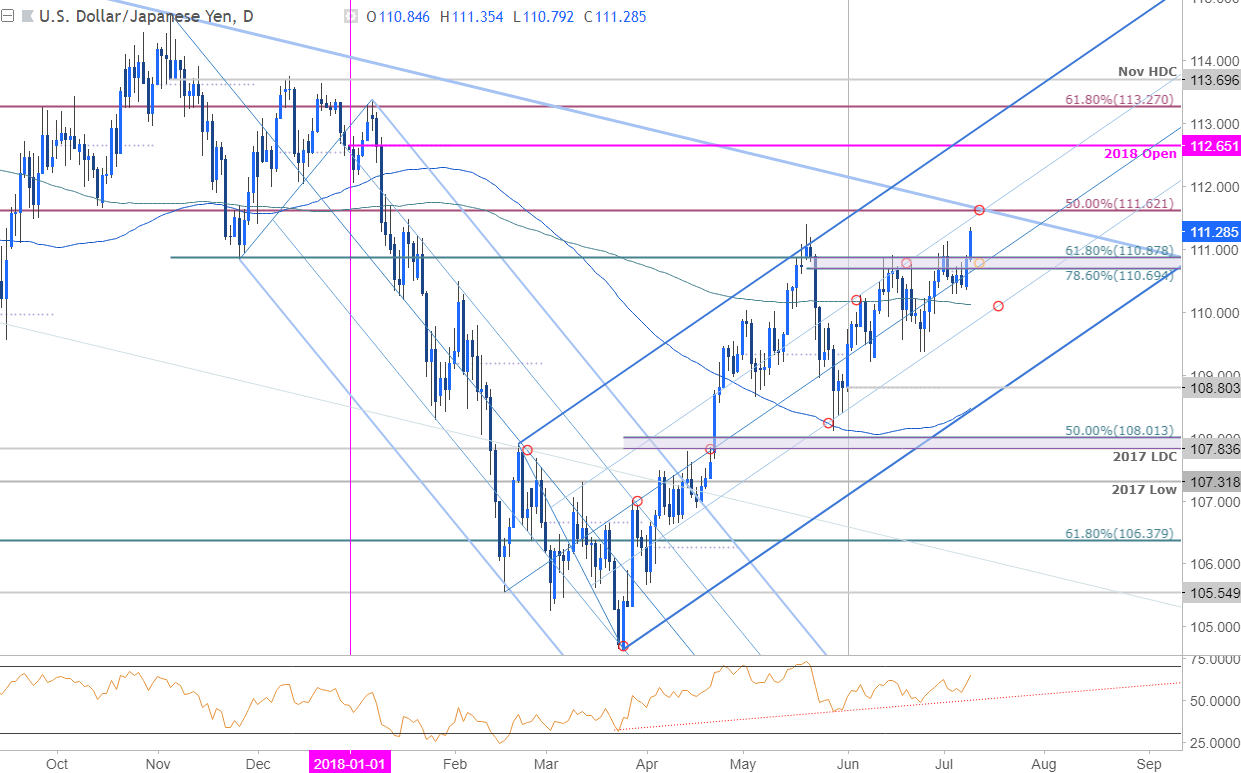
Technical Outlook: In last week’s Technical Perspective on the Japanese Yen, we noted that USD/JPY had continued to consolidate just below a, “key resistance range at 110.88-111.65- a region defined by the 61.8% retracement of the November sell-off and the 50% of the broader decline off the late-2016 high.” Note that basic slope resistance extending off the 2017 high and the 50-line of the operative ascending pitchfork formation converge on this upper bounds and further highlight the technical significance of this level.
Initial daily support now rests at 110.70 with bullish invalidation now raised to the 200- day moving average / 50-line around ~110. A breach / close above 111.62 would be needed to keep the long-bias viable with such a scenario targeting the 2018 open at 112.65 backed by the 61.38% retracement at 113.27.
New to Forex Trading? Get started with this Free Beginners Guide
USD/JPY 240min Price Chart
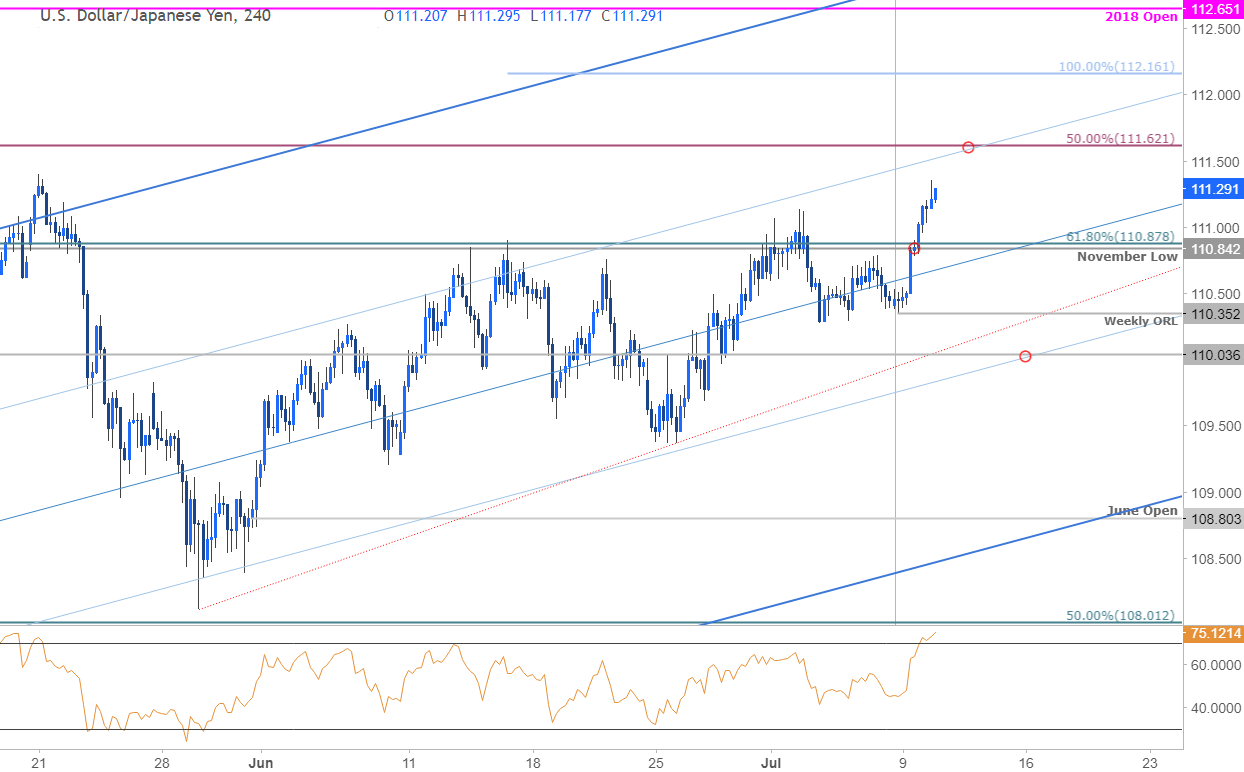
Notes: closer look at USD/JPY price action shows the pair approaching the May highs at 111.40 with intraday RSI deep in overbought territory. The immediate threat remains higher but we’re on the lookout for a reaction on a move into confluence resistance at 111.62 – area of interest for possible exhaustion / short entries.
Why does the average trader lose? Avoid these Mistakes in your trading
Bottom line: We’re looking for exhaustion on a stretch into this key resistance zone in the days ahead. Look for a break below the weekly opening-range lows to get this going with a drop sub-110.04 needed to suggest a more significant high is in place.
For a complete breakdown of Michael’s trading strategy, review his Foundations of Technical Analysis series on Building a Trading Strategy
USD/JPY Trader Positioning
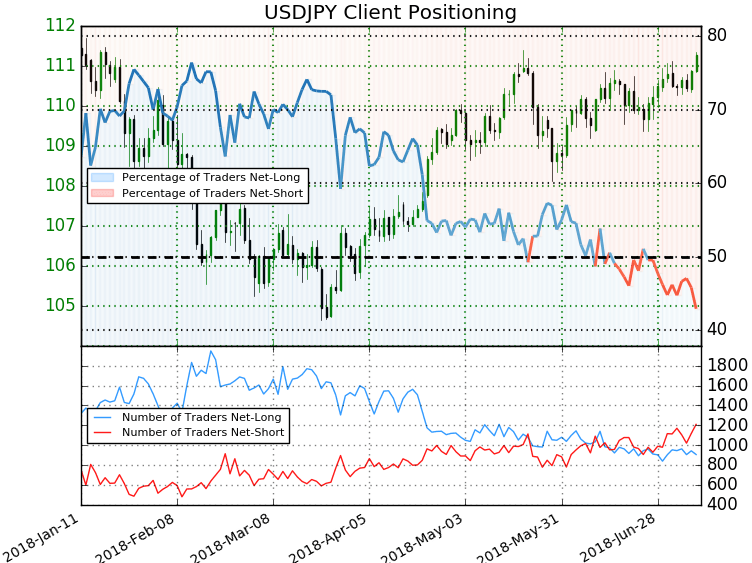
- A summary of IG Client Sentiment shows traders are net-short the USD/JPY- the ratio stands at +-1.33 (42.9% of traders are long) – bullish reading
- Traders have remained net-short since June 28th; price has moved 0.9% higher since then
- Long positions are 5.5% lower than yesterday and 3.0% lower from last week
- Short positions are11.9% higher than yesterday and 10.4% higher from last week
- We typically take a contrarian view to crowd sentiment, and the fact traders are net-short suggests USD/JPY prices may continue to rise. Traders are further net-short than yesterday and last week, and the combination of current positioning and recent changes gives us a stronger USD/JPY-bullish contrarian trading bias from a sentiment standpoint.
See how shifts in USD/JPY retail positioning are impacting trend- Learn more about sentiment!
---
Relevant USD/JPY Data Releases
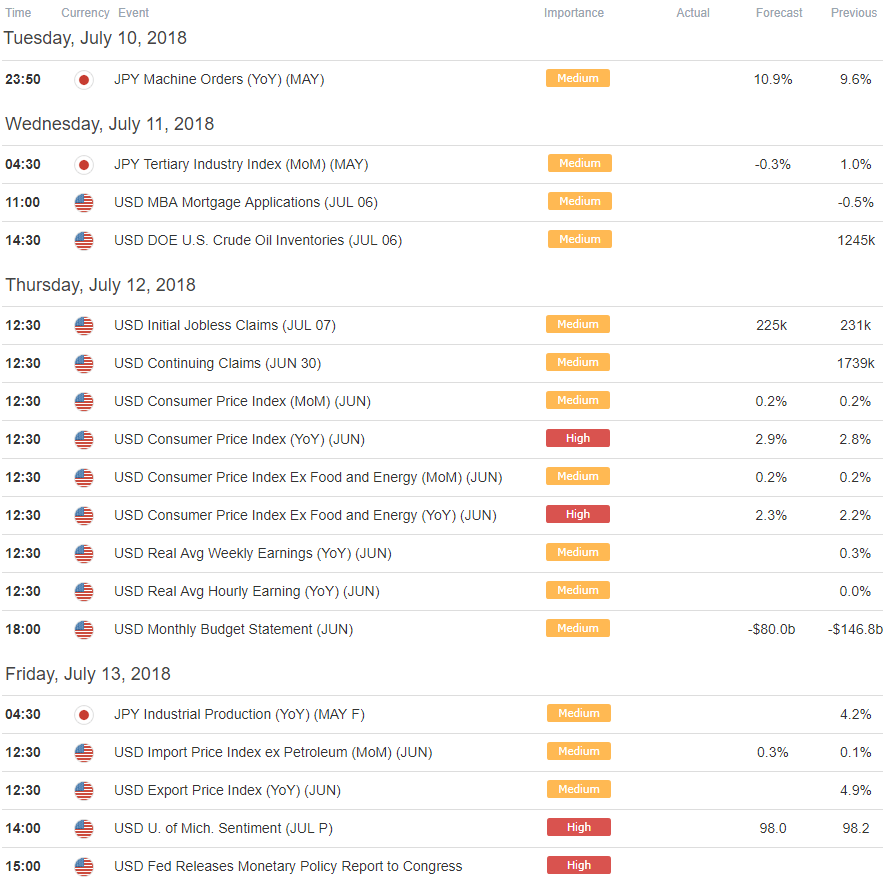
Economic Calendar - latest economic developments and upcoming event risk
Other Setups in Play
- AUD/USD Technical Outlook: Trading the Aussie Price Recovery
- US Dollar Recovery to Offer Opportunity– Pending Weekly Trade Setups (Webinar)
- USD/CAD Price Analysis: Canadian Dollar on the Offensive
- XAU/USD Technical Outlook: Gold Prices Meltdown into Q2 Close
- EUR/USD Price Analysis: Euro Breakdown Targets 2018 Lows
- Written by Michael Boutros, Currency Strategist with DailyFX
Follow Michael on Twitter @MBForex or contact him at mboutros@dailyfx.com


