


CRUDE OIL & GOLD TALKING POINTS:
- Crude oil price chart warns of topping as markets eye US payrolls data
- Gold prices may probe above $2100/oz as real rates turn more negative
- US fiscal impasse, escalating China tensions may sour market sentiment
Crude oil prices idled yesterday, conspicuously diverging from an otherwise risk-on backdrop. While it is a bit too early to draw firm conclusions, it is nevertheless eye-catching when any asset is unable to capitalize on what is ostensibly a bullish catalyst.
That cyclically-geared oil prices were unable to follow stocks upward. One possibility is that some sort of asset-specific catalyst overpowered risk trends. That may have been the case: the OPEC+ group is on course to wind down its output cuts scheme, which may have weighed on prices.
Another explanation may be that gains higher equities reflected something other than optimism about the economic backdrop, and whatever that is did little for energy demand bets. That seems like the likelier scenario considering other growth-geared commodities like natural gas and copper were similarly soggy.
Tellingly, gold prices did rise alongside shares while real interest rates pushed deeper into negative territory. This suggests a now-familiar dynamic was in play: capital flowed to assets with a better-than-negative rate of return. Global shares still offer a close to 2 percent dividend yield, while the de-facto rate on gold is 0.
CRUDE OIL, GOLD MAY DIVERGE IF US JOBS DATA UNDERWHELMS
Looking ahead, July’s US jobs report is in focus on the data docket. It is expected to show a 1.48 million rise in nonfarm payrolls, the smallest gain in three months. Leading ADP data warned of disappointment, flagging an increase of just 167,000.
A similarly staid result on official figures may stoke concerns about the growth implications of the second viral wave of Covid 19, weighing on cyclical assets including crude oil. Gold might continue to find support however as traders lean on the result to extrapolate a longer-term dovish view on Fed policy.
US FISCAL IMPASSE, ESCALATING CHINA TENSIONS SOUR MARKET MOOD
This divergence may be amplified as the US Congress struggles to reach a deal on another round of fiscal stimulus before a self-imposed deadline today. Even if a deal is reached in the eleventh hour, a package sized at $2 trillion or lower may register as underwhelming for financial markets.
Escalating tensions between the US and China may be another complicating factor. President Donald Trump issued executive orders banning Chinese social media apps WeChat and TikTok. The administration is also pushing for new rules that might see some Chinese companies delisted from US stock exchanges.
Investors’ mood soured in Asia-Pacific trade as news of Washington’s actions crossed the wires, weighing on regional bourses. Bellwether S&P 500 futures followed suit and now point meaningfully lower, signaling that a risk-off tilt might prevail in the final hours of the trading week.

CRUDE OIL TECHNICAL ANALYSIS
Crude oil prices continue to idle below resistance in the 42.40-43.88 area, with a Shooting Star candlestick and negative RSI divergence warning that a turn lower may be ahead. A daily close below swing low support at 38.74 may target the 34.38-78 zone next. Puncturing resistance may expose the $50/bbl mark.
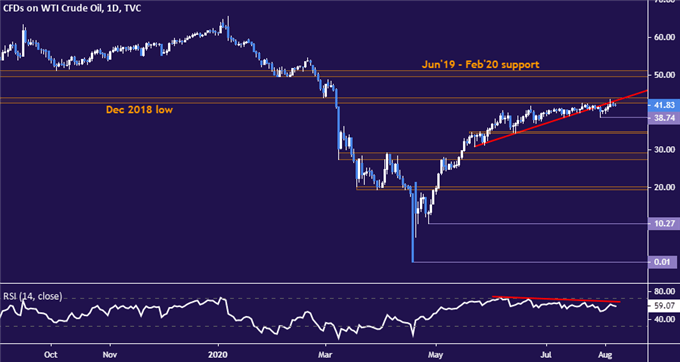
Crude oil price chart created using TradingView
GOLD TECHNICAL ANALYSIS
Gold prices may be set to test the 138.2% Fibonacci expansionat 2105.57. A break above that may expose the 150% barrier at 2142.61. Alternatively, a pullback beyond the 123.6% Fib at 2059.74 probably sees the next downside hurdle at 1985.67, the 100% expansion.
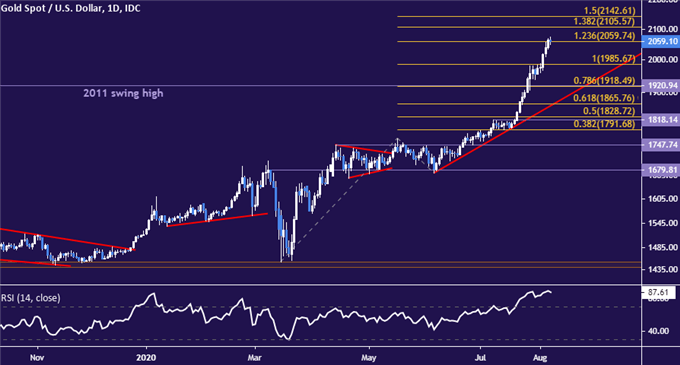
Gold price chart created using TradingView

COMMODITY TRADING RESOURCES
- See our free guide on the drivers of crude oil price trends
- What is your trading personality? Take our quiz to find out
- Join a free live webinar and have your questions answered
--- Written by Ilya Spivak, Head APAC Strategist for DailyFX
To contact Ilya, use the comments section below or @IlyaSpivak on Twitter


